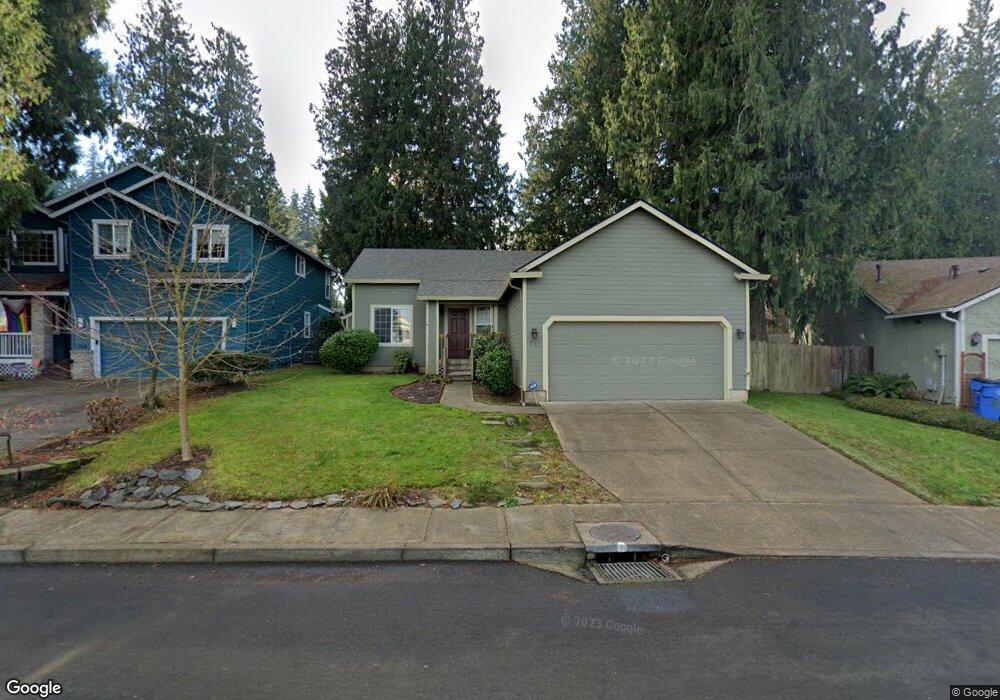
8513 NE 16th Ln Vancouver, WA 98664
North Garrison Heights NeighborhoodEstimated Value: $465,000 - $481,000
3
Beds
2
Baths
1,330
Sq Ft
$354/Sq Ft
Est. Value
About This Home
This home is located at 8513 NE 16th Ln, Vancouver, WA 98664 and is currently estimated at $470,343, approximately $353 per square foot. 8513 NE 16th Ln is a home located in Clark County with nearby schools including Peter S. Ogden Elementary School, McLoughlin Middle School, and Fort Vancouver High School.
Ownership History
Date
Name
Owned For
Owner Type
Purchase Details
Closed on
Oct 16, 2023
Sold by
Menachof Lisa L
Bought by
Menachof Trust and Menachof
Current Estimated Value
Purchase Details
Closed on
Aug 14, 2001
Sold by
Parker Gregory S and Parker Denise Y
Bought by
Menachof Lisa L
Home Financials for this Owner
Home Financials are based on the most recent Mortgage that was taken out on this home.
Original Mortgage
$117,500
Interest Rate
7.19%
Purchase Details
Closed on
Mar 26, 1998
Sold by
Kimball Hill Homes Washington Inc
Bought by
Parker Gregory S and Parker Denise Y
Home Financials for this Owner
Home Financials are based on the most recent Mortgage that was taken out on this home.
Original Mortgage
$127,050
Interest Rate
7.06%
Create a Home Valuation Report for This Property
The Home Valuation Report is an in-depth analysis detailing your home's value as well as a comparison with similar homes in the area
Home Values in the Area
Average Home Value in this Area
Purchase History
| Date | Buyer | Sale Price | Title Company |
|---|---|---|---|
| Menachof Trust | -- | None Listed On Document | |
| Menachof Lisa L | $146,900 | Chicago Title Insurance | |
| Parker Gregory S | $131,902 | Chicago Title Insurance Co |
Source: Public Records
Mortgage History
| Date | Status | Borrower | Loan Amount |
|---|---|---|---|
| Previous Owner | Menachof Lisa L | $117,500 | |
| Previous Owner | Parker Gregory S | $127,050 |
Source: Public Records
Tax History Compared to Growth
Tax History
| Year | Tax Paid | Tax Assessment Tax Assessment Total Assessment is a certain percentage of the fair market value that is determined by local assessors to be the total taxable value of land and additions on the property. | Land | Improvement |
|---|---|---|---|---|
| 2025 | $4,020 | $433,111 | $189,750 | $243,361 |
| 2024 | $3,852 | $411,484 | $189,750 | $221,734 |
| 2023 | $3,839 | $411,678 | $191,400 | $220,278 |
| 2022 | $3,557 | $411,852 | $191,400 | $220,452 |
| 2021 | $3,293 | $355,600 | $165,000 | $190,600 |
| 2020 | $3,020 | $310,238 | $123,228 | $187,010 |
| 2019 | $2,766 | $294,850 | $102,690 | $192,160 |
| 2018 | $2,998 | $279,702 | $0 | $0 |
| 2017 | $2,588 | $251,693 | $0 | $0 |
| 2016 | $2,436 | $226,698 | $0 | $0 |
| 2015 | $2,451 | $203,942 | $0 | $0 |
| 2014 | -- | $194,048 | $0 | $0 |
| 2013 | -- | $166,462 | $0 | $0 |
Source: Public Records
Map
Nearby Homes
- 8702 NE 17th St Unit 61
- 8803 NE 14th St
- 1411 NE 90th Ave
- 1604 NE 91st Ave
- 8009 NE 16th St
- 2016 NE 87th Ave
- 1007 NE 82nd Ave
- 9008 NE 11th St
- 8405 NE 10th St
- 8107 NE 20th St Unit 17
- 7905 NE 19th Cir
- 9511 NE Pinecreek St
- 8503 NE 25th St
- 8212 NE Snowberry Loop
- 1918 NE 77th Place
- 2312 NE 79th Ave
- 2112 NE 79th Ave Unit H103
- 7632 NE 20th St
- 2305 NE 94th Ct
- 2402 NE 79th Ct Unit AE13
- 8509 NE 16th Ln
- 8517 NE 16th Ln
- 8514 NE 15th St
- 8508 NE 15th St
- 8526 NE 15th St
- 8505 NE 16th Ln
- 8504 NE 15th St
- 8516 NE 16th Ln
- 8508 NE 16th Ln
- 8520 NE 16th Ln
- 8500 NE 15th St
- 8501 NE 16th Ln
- 8530 NE 15th St
- 8504 NE 16th Ln
- 8524 NE 16th Ln
- 8416 NE 15th St
- 8525 NE 15th St
- 8521 NE 15th St
- 8528 NE 16th Ln
- 8505 NE 15th St