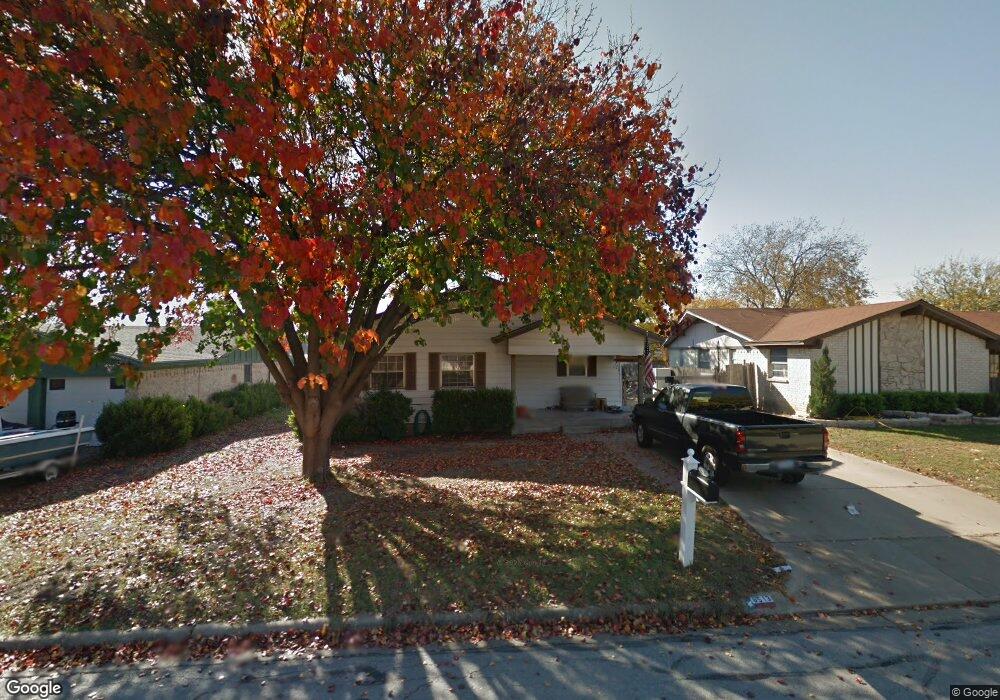
8513 Wilbur St Fort Worth, TX 76108
Estimated Value: $220,232 - $254,000
3
Beds
1
Bath
1,446
Sq Ft
$164/Sq Ft
Est. Value
About This Home
This home is located at 8513 Wilbur St, Fort Worth, TX 76108 and is currently estimated at $237,058, approximately $163 per square foot. 8513 Wilbur St is a home located in Tarrant County with nearby schools including North Elementary School, Brewer Middle School, and Tannahill Intermediate School.
Ownership History
Date
Name
Owned For
Owner Type
Purchase Details
Closed on
Nov 19, 2021
Sold by
Southern Star Capital Llc
Bought by
Carnegie Homes Llc
Current Estimated Value
Home Financials for this Owner
Home Financials are based on the most recent Mortgage that was taken out on this home.
Original Mortgage
$194,774
Interest Rate
3.05%
Mortgage Type
Construction
Purchase Details
Closed on
Nov 4, 1996
Sold by
Scb Real Estate Investments Inc
Bought by
Cavanaugh Michael W and Cavanaugh Jana M
Home Financials for this Owner
Home Financials are based on the most recent Mortgage that was taken out on this home.
Original Mortgage
$38,500
Interest Rate
8.05%
Mortgage Type
FHA
Purchase Details
Closed on
Jun 26, 1996
Sold by
Deviney Vernon O and Deviney Edna
Bought by
Scb Real Estate Investments Inc
Create a Home Valuation Report for This Property
The Home Valuation Report is an in-depth analysis detailing your home's value as well as a comparison with similar homes in the area
Home Values in the Area
Average Home Value in this Area
Purchase History
| Date | Buyer | Sale Price | Title Company |
|---|---|---|---|
| Carnegie Homes Llc | -- | Lawyers Title | |
| Cavanaugh Michael W | -- | -- | |
| Scb Real Estate Investments Inc | -- | Fidelity National Title Agen |
Source: Public Records
Mortgage History
| Date | Status | Borrower | Loan Amount |
|---|---|---|---|
| Closed | Carnegie Homes Llc | $194,774 | |
| Previous Owner | Cavanaugh Michael W | $38,500 |
Source: Public Records
Tax History Compared to Growth
Tax History
| Year | Tax Paid | Tax Assessment Tax Assessment Total Assessment is a certain percentage of the fair market value that is determined by local assessors to be the total taxable value of land and additions on the property. | Land | Improvement |
|---|---|---|---|---|
| 2025 | $2,147 | $155,933 | $34,575 | $121,358 |
| 2024 | $2,147 | $155,933 | $34,575 | $121,358 |
| 2023 | $3,364 | $158,236 | $34,575 | $123,661 |
| 2022 | $3,483 | $137,207 | $25,000 | $112,207 |
| 2021 | $3,216 | $122,186 | $25,000 | $97,186 |
| 2020 | $2,945 | $141,492 | $25,000 | $116,492 |
| 2019 | $2,780 | $135,577 | $25,000 | $110,577 |
| 2018 | $2,013 | $87,846 | $11,000 | $76,846 |
| 2017 | $2,334 | $100,287 | $11,000 | $89,287 |
| 2016 | $2,122 | $113,254 | $11,000 | $102,254 |
| 2015 | $1,573 | $66,000 | $11,000 | $55,000 |
| 2014 | $1,573 | $66,000 | $11,000 | $55,000 |
Source: Public Records
Map
Nearby Homes
- 8401 Clifford St
- 8814 Rockway St
- 627 Hallvale Dr
- 633 Lariat Ln
- 304 Lockwood St
- 308 Hallvale Dr
- 8814 Clifford St
- 311 Russell St
- 8133 Foxfire Ln
- 813 Hackamore St
- 8113 Foxfire Ln
- 8321 Raymond Ave
- 203 East Place
- 8811 Silver Creek Rd
- 9005 Glenn Dr
- 201 N Normandale St
- 105 Lockwood St
- 7945 White Settlement Rd
- 8417 Omaha Dr
- 200 Waynell St