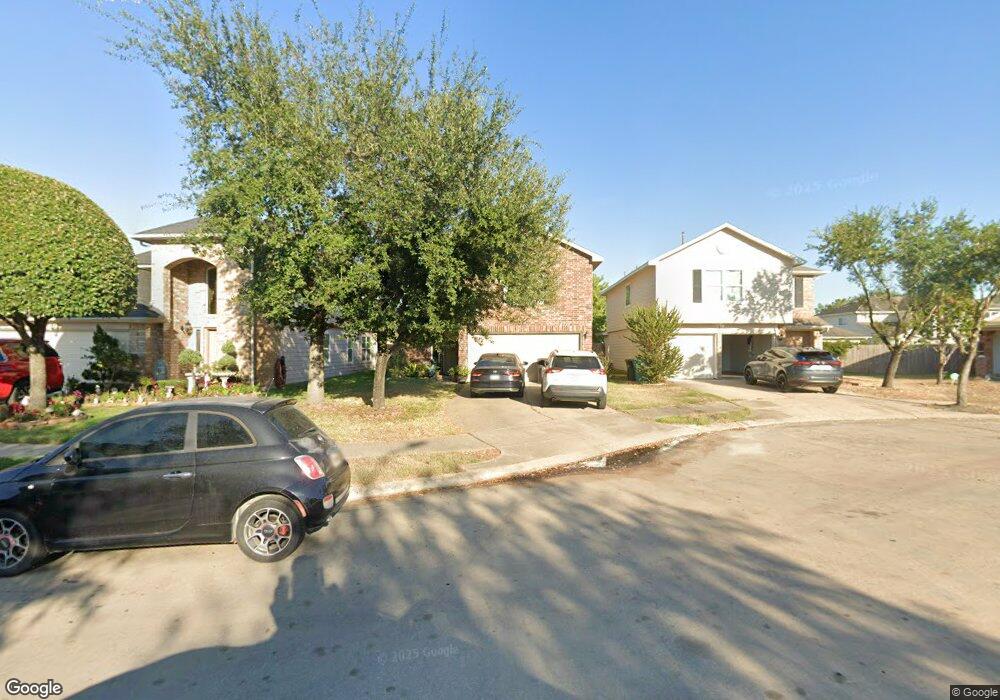
8514 Bartletts Harbor Ct Houston, TX 77040
Greater Inwood NeighborhoodEstimated Value: $294,325 - $328,000
4
Beds
3
Baths
2,263
Sq Ft
$136/Sq Ft
Est. Value
About This Home
This home is located at 8514 Bartletts Harbor Ct, Houston, TX 77040 and is currently estimated at $307,331, approximately $135 per square foot. 8514 Bartletts Harbor Ct is a home located in Harris County with nearby schools including Holbrook Elementary School, Dean Middle School, and Jersey Village High School.
Ownership History
Date
Name
Owned For
Owner Type
Purchase Details
Closed on
Jun 26, 2017
Sold by
Bui Jimmy Thenang and Bui Kim Ly
Bought by
Jessie Diana
Current Estimated Value
Home Financials for this Owner
Home Financials are based on the most recent Mortgage that was taken out on this home.
Original Mortgage
$6,591
Outstanding Balance
$5,485
Interest Rate
3.95%
Mortgage Type
Stand Alone Second
Estimated Equity
$301,846
Purchase Details
Closed on
Jan 20, 2012
Sold by
Gateway Homes Ltd
Bought by
Bui Jimmy Thenang
Home Financials for this Owner
Home Financials are based on the most recent Mortgage that was taken out on this home.
Original Mortgage
$125,400
Interest Rate
3.95%
Mortgage Type
New Conventional
Create a Home Valuation Report for This Property
The Home Valuation Report is an in-depth analysis detailing your home's value as well as a comparison with similar homes in the area
Home Values in the Area
Average Home Value in this Area
Purchase History
| Date | Buyer | Sale Price | Title Company |
|---|---|---|---|
| Jessie Diana | -- | Fidelity National Title | |
| Bui Jimmy Thenang | -- | None Available |
Source: Public Records
Mortgage History
| Date | Status | Borrower | Loan Amount |
|---|---|---|---|
| Open | Jessie Diana | $6,591 | |
| Open | Jessie Diana | $184,888 | |
| Previous Owner | Bui Jimmy Thenang | $125,400 |
Source: Public Records
Tax History Compared to Growth
Tax History
| Year | Tax Paid | Tax Assessment Tax Assessment Total Assessment is a certain percentage of the fair market value that is determined by local assessors to be the total taxable value of land and additions on the property. | Land | Improvement |
|---|---|---|---|---|
| 2025 | $4,520 | $317,815 | $51,177 | $266,638 |
| 2024 | $4,520 | $313,767 | $51,177 | $262,590 |
| 2023 | $4,520 | $322,272 | $51,177 | $271,095 |
| 2022 | $6,123 | $273,924 | $42,613 | $231,311 |
| 2021 | $5,819 | $232,758 | $42,613 | $190,145 |
| 2020 | $5,450 | $204,715 | $30,380 | $174,335 |
| 2019 | $5,416 | $195,443 | $20,593 | $174,850 |
| 2018 | $1,726 | $181,113 | $20,593 | $160,520 |
| 2017 | $5,016 | $181,113 | $20,593 | $160,520 |
| 2016 | $4,836 | $174,624 | $20,593 | $154,031 |
| 2015 | $3,161 | $174,624 | $20,593 | $154,031 |
| 2014 | $3,161 | $148,768 | $19,574 | $129,194 |
Source: Public Records
Map
Nearby Homes
- 8610 Twillingate Ln
- 6902 Anson Point Ln
- 8615 Black Tern Ln
- 7218 Stonegate Dr
- 6407 Deirdre Anne Dr
- 6338 Maple Hill Dr
- 6310 Silver Chalice Dr
- 7259 Shady Arbor Ln
- 7318 Shady Grove Ln
- 6202 Wagonwheel Cir
- 6931 Wagonwheel Ln
- 7218 Jadewood Dr Unit 770
- 6918 Bent Branch Dr
- 6430 Pirtlewood Cir
- 7219 Ridge Oak Dr
- 9350 Guywood St
- 7146 Bayou Forest Dr
- 6311 Fairwood Dr
- 7606 Victory Dr
- 9331 Deanwood St
- 8602 Bartletts Harbor Ct
- 8510 Bartletts Harbor Ct
- 8606 Bartletts Harbor Ct
- 8515 Bartletts Harbor Ct
- 8603 Bartletts Harbor Ct
- 8506 Bartletts Harbor Ct
- 8610 Bartletts Harbor Ct
- 8511 Bartletts Harbor Ct
- 8607 Bartletts Harbor Ct
- 8535 Gander Bayshore Ln
- 8531 Gander Bayshore Ln
- 8502 Bartletts Harbor Ct
- 8603 Gander Bayshore Ln
- 8611 Bartletts Harbor Ct
- 8614 Bartletts Harbor Ct
- 8507 Bartletts Harbor Ct
- 8607 Gander Bayshore Ln
- 8527 Gander Bayshore Ln
- 8503 Bartletts Harbor Ct
- 8611 Gander Bayshore Ln