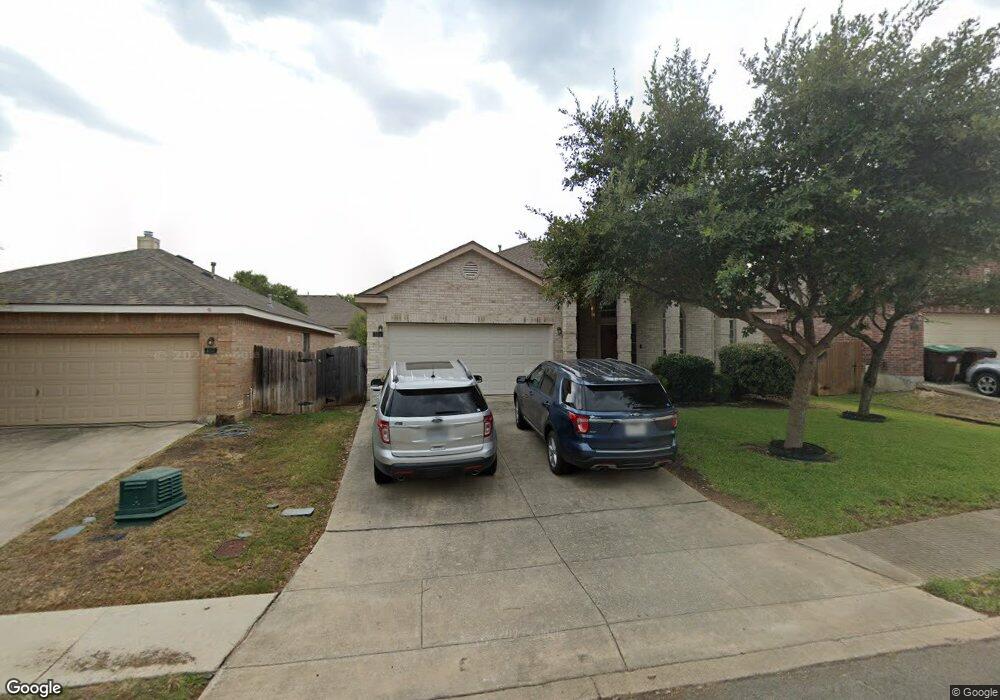
8514 Spicewood Bend San Antonio, TX 78255
Cross Mountain NeighborhoodEstimated Value: $367,548 - $477,000
4
Beds
2
Baths
2,262
Sq Ft
$183/Sq Ft
Est. Value
About This Home
This home is located at 8514 Spicewood Bend, San Antonio, TX 78255 and is currently estimated at $414,137, approximately $183 per square foot. 8514 Spicewood Bend is a home located in Bexar County with nearby schools including Aue Elementary School, Garcia Middle School, and Brandeis High School.
Ownership History
Date
Name
Owned For
Owner Type
Purchase Details
Closed on
Apr 8, 2019
Sold by
Knight Shirley F
Bought by
Knight Shirley F and The Knight Living Trust
Current Estimated Value
Purchase Details
Closed on
Jun 25, 2012
Sold by
Knight Shirley F
Bought by
Knight Shirley
Home Financials for this Owner
Home Financials are based on the most recent Mortgage that was taken out on this home.
Original Mortgage
$168,000
Interest Rate
3.8%
Mortgage Type
Credit Line Revolving
Purchase Details
Closed on
Aug 31, 2005
Sold by
Knight John W and Knight Shirley F
Bought by
Knight John W and Knight Shirley F
Purchase Details
Closed on
Jun 24, 2005
Sold by
Continental Homes Of Texas Lp
Bought by
Knight John W and Knight Shirley F
Home Financials for this Owner
Home Financials are based on the most recent Mortgage that was taken out on this home.
Original Mortgage
$147,600
Interest Rate
5.67%
Mortgage Type
Fannie Mae Freddie Mac
Create a Home Valuation Report for This Property
The Home Valuation Report is an in-depth analysis detailing your home's value as well as a comparison with similar homes in the area
Home Values in the Area
Average Home Value in this Area
Purchase History
| Date | Buyer | Sale Price | Title Company |
|---|---|---|---|
| Knight Shirley F | -- | None Available | |
| Knight Shirley | -- | First American Title | |
| Knight John W | -- | -- | |
| Knight John W | -- | Dhi Title |
Source: Public Records
Mortgage History
| Date | Status | Borrower | Loan Amount |
|---|---|---|---|
| Previous Owner | Knight Shirley | $168,000 | |
| Previous Owner | Knight John W | $147,600 |
Source: Public Records
Tax History Compared to Growth
Tax History
| Year | Tax Paid | Tax Assessment Tax Assessment Total Assessment is a certain percentage of the fair market value that is determined by local assessors to be the total taxable value of land and additions on the property. | Land | Improvement |
|---|---|---|---|---|
| 2025 | $2,093 | $373,790 | $82,900 | $290,890 |
| 2024 | $2,093 | $355,949 | $82,900 | $294,540 |
| 2023 | $2,093 | $323,590 | $82,900 | $296,520 |
| 2022 | $5,841 | $294,173 | $59,070 | $290,850 |
| 2021 | $5,509 | $267,430 | $42,000 | $225,430 |
| 2020 | $5,315 | $252,530 | $42,000 | $210,530 |
| 2019 | $5,503 | $252,820 | $42,000 | $210,820 |
| 2018 | $5,410 | $248,480 | $42,000 | $206,480 |
| 2017 | $5,248 | $240,290 | $42,000 | $198,290 |
| 2016 | $4,836 | $221,410 | $42,000 | $179,410 |
| 2015 | $3,647 | $221,520 | $42,000 | $179,520 |
| 2014 | $3,647 | $204,370 | $0 | $0 |
Source: Public Records
Map
Nearby Homes
- 8506 Driftwood Hill
- 8355 Piney Wood Run
- 8347 Piney Wood Run
- 8343 Bordeaux Bay
- 24003 Verde River
- 8306 Piney Wood Run
- 24710 Cloudy Creek
- 24630 Wine Rose Path
- 24707 Wine Rose Path
- 8226 Piney Wood Run
- 24406 Flint Creek
- 24831 Cloudy Creek
- 8531 Colfax Cove
- 8523 Colfax Cove
- 8535 Colfax Cove
- 24406 Treaty Creek
- 25007 Seal Cove
- 8818 Apache Trail
- 24915 White Creek
- 8902 Saddle Trail
- 8518 Spicewood Bend
- 8510 Spicewood Bend
- 8522 Spicewood Bend
- 8506 Spicewood Bend
- 8515 Driftwood Hill
- 8511 Driftwood Hill
- 8519 Driftwood Hill
- 8507 Driftwood Hill
- 8523 Driftwood Hill
- 8526 Spicewood Bend
- 8511 Spicewood Bend
- 8515 Spicewood Bend
- 8507 Spicewood Bend
- 8519 Spicewood Bend
- 8527 Driftwood Hill
- 8503 Spicewood Bend
- 8523 Spicewood Bend
- 8530 Spicewood Bend
- 24318 Woodrose Park
- 8531 Driftwood Hill