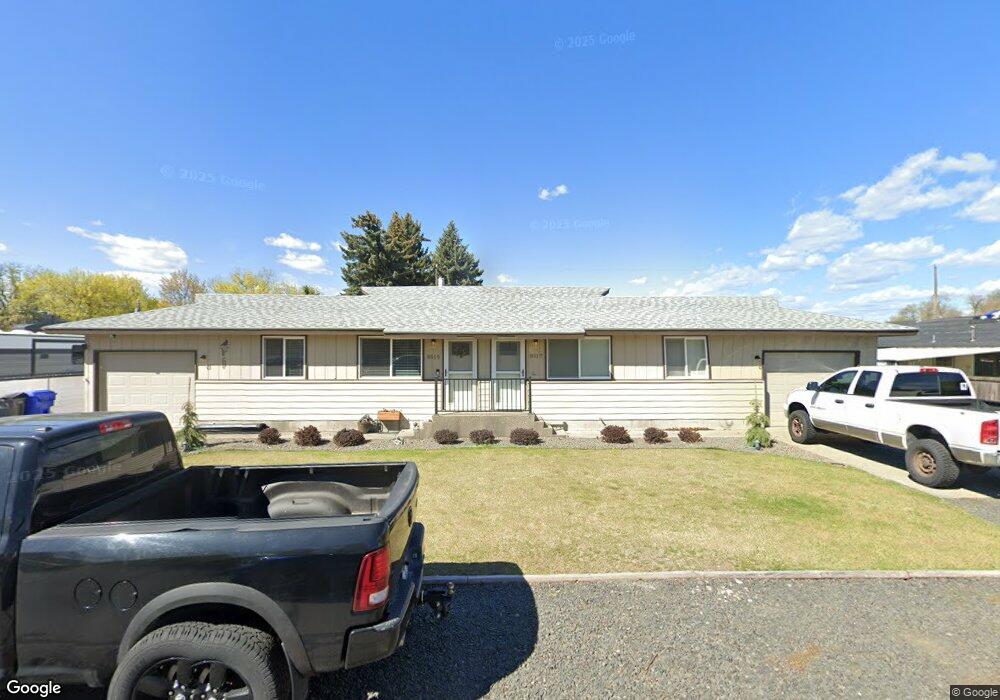
8515 E Sinto Ave Spokane Valley, WA 99212
Dishman Hills NeighborhoodEstimated Value: $414,413 - $529,000
5
Beds
2
Baths
1,600
Sq Ft
$285/Sq Ft
Est. Value
About This Home
This home is located at 8515 E Sinto Ave, Spokane Valley, WA 99212 and is currently estimated at $456,353, approximately $285 per square foot. 8515 E Sinto Ave is a home located in Spokane County with nearby schools including Ness Elementary School, Centennial Middle School, and Woodland Montessori School.
Ownership History
Date
Name
Owned For
Owner Type
Purchase Details
Closed on
Oct 17, 2018
Sold by
Lindley Laura C
Bought by
Hamblen Bryan C and Hamblen Michaela C
Current Estimated Value
Home Financials for this Owner
Home Financials are based on the most recent Mortgage that was taken out on this home.
Original Mortgage
$193,325
Outstanding Balance
$168,591
Interest Rate
4.5%
Mortgage Type
FHA
Estimated Equity
$287,762
Purchase Details
Closed on
May 24, 2001
Sold by
Bloom Robert B and Wark Marjorie E
Bought by
Lindley Laura C
Home Financials for this Owner
Home Financials are based on the most recent Mortgage that was taken out on this home.
Original Mortgage
$112,238
Interest Rate
7.15%
Purchase Details
Closed on
Jun 9, 1997
Sold by
Lewis Robert Kent
Bought by
Bloom Robert B and Bloom Marjorie E
Home Financials for this Owner
Home Financials are based on the most recent Mortgage that was taken out on this home.
Original Mortgage
$89,550
Interest Rate
7.98%
Create a Home Valuation Report for This Property
The Home Valuation Report is an in-depth analysis detailing your home's value as well as a comparison with similar homes in the area
Home Values in the Area
Average Home Value in this Area
Purchase History
| Date | Buyer | Sale Price | Title Company |
|---|---|---|---|
| Hamblen Bryan C | $200,000 | Spokane County Title Co | |
| Lindley Laura C | $114,000 | Pioneer Title Company | |
| Bloom Robert B | $99,500 | Pacific Nw Title |
Source: Public Records
Mortgage History
| Date | Status | Borrower | Loan Amount |
|---|---|---|---|
| Open | Hamblen Bryan C | $193,325 | |
| Previous Owner | Lindley Laura C | $112,238 | |
| Previous Owner | Bloom Robert B | $89,550 |
Source: Public Records
Tax History Compared to Growth
Tax History
| Year | Tax Paid | Tax Assessment Tax Assessment Total Assessment is a certain percentage of the fair market value that is determined by local assessors to be the total taxable value of land and additions on the property. | Land | Improvement |
|---|---|---|---|---|
| 2025 | $4,761 | $420,500 | $95,000 | $325,500 |
| 2024 | $4,761 | $398,600 | $75,000 | $323,600 |
| 2023 | $4,658 | $386,100 | $75,000 | $311,100 |
| 2022 | $3,863 | $386,100 | $75,000 | $311,100 |
| 2021 | $3,561 | $233,300 | $45,000 | $188,300 |
| 2020 | $3,451 | $210,300 | $45,000 | $165,300 |
| 2019 | $2,928 | $195,200 | $35,000 | $160,200 |
| 2018 | $3,067 | $169,800 | $32,000 | $137,800 |
| 2017 | $2,749 | $150,900 | $32,000 | $118,900 |
| 2016 | $2,711 | $145,300 | $32,000 | $113,300 |
| 2015 | $2,660 | $138,900 | $32,000 | $106,900 |
| 2014 | -- | $141,700 | $30,000 | $111,700 |
| 2013 | -- | $0 | $0 | $0 |
Source: Public Records
Map
Nearby Homes
- 1422 N Bessie Rd
- 1504 N Vista Rd
- 1216 N Lewis Rd
- 9006 E Sinto Ave
- 8808 E Cataldo Ave
- 8101 E Baldwin Ave
- 2105 N Sipple Rd
- 7815 E Mission Ave
- 7912 E Baldwin Ave
- 0 N Willow Rd
- 8209 E Knox Ave
- 1719 N Willow Rd
- 1902 N Ely Rd
- 7617 E Nora Ave
- 7616 E Baldwin Ave
- 1507 N Park Rd
- 1403 N Farr Rd
- 8702 E Valleyway Ave
- 8125 E Baldwin Ave
- 7800 E Alki Ave Unit 59
- 1407 N Laura Rd
- 8505 E Sinto Ave
- 1410 N Bessie Rd
- 1415 N Laura Rd
- 1416 N Bessie Rd
- 1322 N Bessie Rd
- 8516 E Sinto Ave
- 1421 N Laura Rd
- 8522 E Sinto Ave
- 1408 N Laura Rd
- 1316 N Bessie Rd
- 1403 N Bessie Rd
- 1416 N Laura Rd
- 8608 E Sinto Ave
- 1413 N Bessie Rd
- 1421 N Bessie Rd
- 8607 E Sinto Ave
- 1503 N Laura Rd
- 8511 E Sharp Ave
- 8517 E Sharp Ave