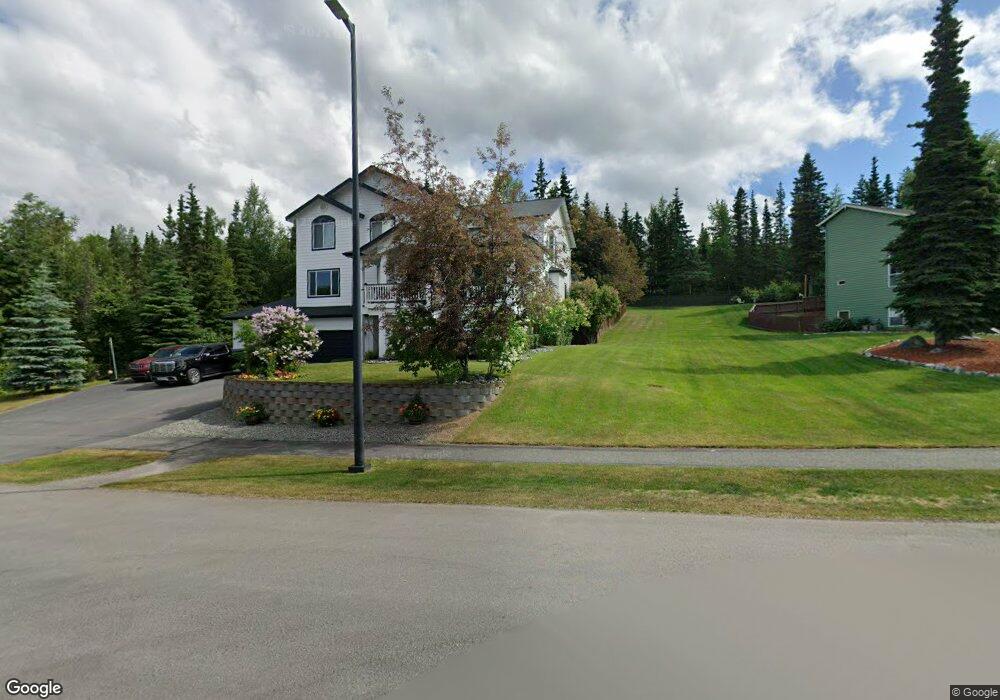
8515 Sahalee Dr Anchorage, AK 99507
Abbott Loop NeighborhoodEstimated Value: $816,000 - $1,214,865
5
Beds
4
Baths
5,754
Sq Ft
$177/Sq Ft
Est. Value
About This Home
This home is located at 8515 Sahalee Dr, Anchorage, AK 99507 and is currently estimated at $1,019,622, approximately $177 per square foot. 8515 Sahalee Dr is a home located in Anchorage Municipality with nearby schools including Trailside Elementary, Hanshew Middle School, and Service High School.
Ownership History
Date
Name
Owned For
Owner Type
Purchase Details
Closed on
Nov 16, 2015
Sold by
Lee Eun Yong
Bought by
Gay Christopher Montell
Current Estimated Value
Home Financials for this Owner
Home Financials are based on the most recent Mortgage that was taken out on this home.
Original Mortgage
$640,000
Outstanding Balance
$503,562
Interest Rate
3.8%
Mortgage Type
New Conventional
Estimated Equity
$516,060
Purchase Details
Closed on
Nov 23, 2005
Sold by
Lee Eun Yong and Lee Eun Y
Bought by
Eun Yong Lee Revocable Trust and Lee Eun Yong
Purchase Details
Closed on
Aug 3, 2004
Sold by
Guarderas Luis Gilberto
Bought by
Lee Eun Y
Purchase Details
Closed on
Jan 2, 2003
Sold by
Guarderas Luis G
Bought by
Lee Eun Yong
Create a Home Valuation Report for This Property
The Home Valuation Report is an in-depth analysis detailing your home's value as well as a comparison with similar homes in the area
Home Values in the Area
Average Home Value in this Area
Purchase History
| Date | Buyer | Sale Price | Title Company |
|---|---|---|---|
| Gay Christopher Montell | -- | Atga | |
| Eun Yong Lee Revocable Trust | -- | -- | |
| Lee Eun Y | -- | -- | |
| Lee Eun Yong | -- | -- |
Source: Public Records
Mortgage History
| Date | Status | Borrower | Loan Amount |
|---|---|---|---|
| Open | Gay Christopher Montell | $640,000 |
Source: Public Records
Tax History Compared to Growth
Tax History
| Year | Tax Paid | Tax Assessment Tax Assessment Total Assessment is a certain percentage of the fair market value that is determined by local assessors to be the total taxable value of land and additions on the property. | Land | Improvement |
|---|---|---|---|---|
| 2025 | $17,797 | $1,164,200 | $141,000 | $1,023,200 |
| 2024 | $17,797 | $1,102,300 | $141,000 | $961,300 |
| 2023 | $16,650 | $977,700 | $141,000 | $836,700 |
| 2022 | $15,808 | $938,700 | $141,000 | $797,700 |
| 2021 | $15,847 | $879,400 | $141,000 | $738,400 |
| 2020 | $14,700 | $864,700 | $141,000 | $723,700 |
| 2019 | $13,747 | $840,300 | $141,000 | $699,300 |
| 2018 | $13,556 | $826,600 | $141,000 | $685,600 |
| 2017 | $13,288 | $848,500 | $141,000 | $707,500 |
| 2016 | $11,488 | $922,500 | $141,000 | $781,500 |
| 2015 | $11,488 | $871,400 | $141,000 | $730,400 |
| 2014 | $11,488 | $778,700 | $120,100 | $658,600 |
Source: Public Records
Map
Nearby Homes
- 8933 Sahalee Dr
- 4041 Truro Dr
- 9203 Strutz Ave
- 4000 Justin Cir
- 3930 Eric Cir
- 4011 Iona Cir
- 112 Chelsea St
- 3831 Winchester Loop
- 000 Valley View Dr
- 7811 Kiana Cir
- 9191 Chapelle Cir
- 8203 Parkridge Cir
- Lt 87 Carlson Rd
- L82 Carlson Rd
- 8662 Spruce Brook St
- 8944 Little Brook St
- 8131 Medellin Cir
- 7511 Randamar Place
- 8530 Gordon Cir
- 3220 Travis Ln
- L2 Sahalee Dr
- 8535 Sahalee Dr
- 4739 Egret Rock Cir
- 8605 Sahalee Dr
- 8514 Cormorant Cove Cir
- 8502 Cormorant Cove Cir
- 8528 Cormorant Cove Cir
- 4738 Egret Rock Cir
- 8446 Cormorant Cove Cir
- 8540 Sahalee Dr
- L2 B1 Egret Rock Cir
- L67 B2 Egret Rock Cir
- 4727 Egret Rock Cir
- 8540 Cormorant Cove Cir
- 8550 Sahalee Dr
- 8430 Cormorant Cove Cir
- 8606 Sahalee Dr
- 4724 Egret Rock Cir
- L41 B2 Cormorant Cove Cir
- L48 B2 Cormorant Cove Cir*