Estimated Value: $382,637 - $450,000
4
Beds
3
Baths
2,938
Sq Ft
$140/Sq Ft
Est. Value
About This Home
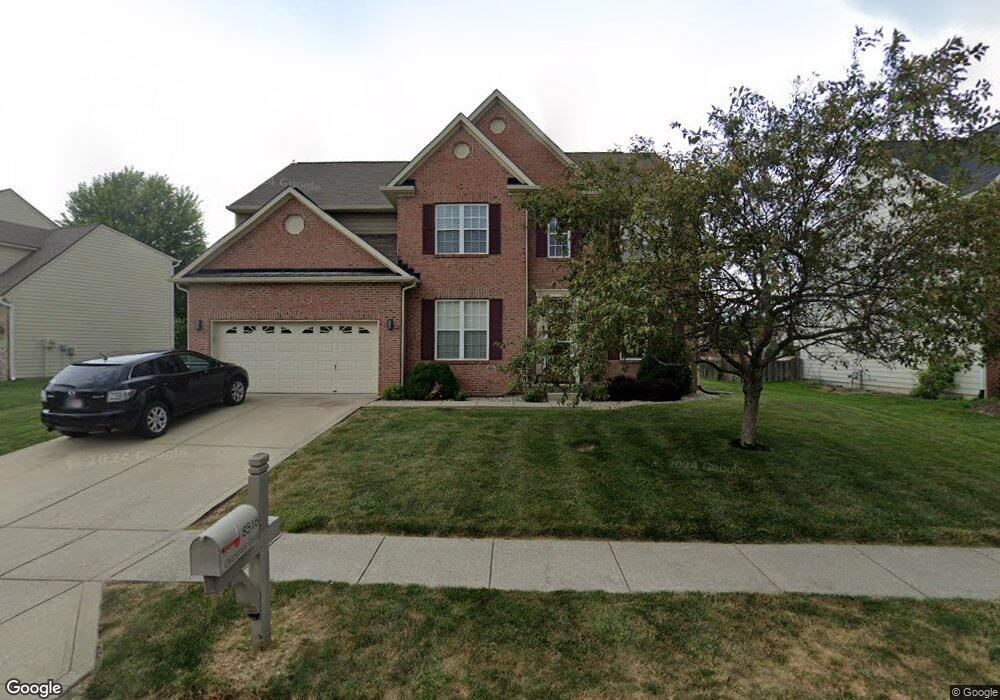
This home is located at 8516 Charleston Ct, Avon, IN 46123 and is currently estimated at $411,159, approximately $139 per square foot. 8516 Charleston Ct is a home located in Hendricks County with nearby schools including Maple Elementary School, White Oak Elementary School, and Avon Middle School North.
Ownership History
Date
Name
Owned For
Owner Type
Purchase Details
Closed on
May 26, 2010
Sold by
Ted Everett Investments Llc
Bought by
Gott William D and Gott Nicole M
Current Estimated Value
Home Financials for this Owner
Home Financials are based on the most recent Mortgage that was taken out on this home.
Original Mortgage
$122,000
Outstanding Balance
$78,282
Interest Rate
4.12%
Mortgage Type
New Conventional
Estimated Equity
$332,877
Purchase Details
Closed on
Jan 21, 2010
Sold by
Sickels Dexter and Fmf Capital Llc
Bought by
Ted Everett Investments Llc
Purchase Details
Closed on
Feb 24, 2006
Sold by
Kbrg Indianapolis Llc
Bought by
Keystone Indianapolis Llc
Home Financials for this Owner
Home Financials are based on the most recent Mortgage that was taken out on this home.
Original Mortgage
$191,120
Interest Rate
8.84%
Mortgage Type
Adjustable Rate Mortgage/ARM
Create a Home Valuation Report for This Property
The Home Valuation Report is an in-depth analysis detailing your home's value as well as a comparison with similar homes in the area
Home Values in the Area
Average Home Value in this Area
Purchase History
| Date | Buyer | Sale Price | Title Company |
|---|---|---|---|
| Gott William D | -- | None Available | |
| Ted Everett Investments Llc | $150,869 | None Available | |
| Keystone Indianapolis Llc | -- | Midwest Title Corporation |
Source: Public Records
Mortgage History
| Date | Status | Borrower | Loan Amount |
|---|---|---|---|
| Open | Gott William D | $122,000 | |
| Previous Owner | Keystone Indianapolis Llc | $191,120 |
Source: Public Records
Tax History Compared to Growth
Tax History
| Year | Tax Paid | Tax Assessment Tax Assessment Total Assessment is a certain percentage of the fair market value that is determined by local assessors to be the total taxable value of land and additions on the property. | Land | Improvement |
|---|---|---|---|---|
| 2024 | $3,965 | $346,700 | $48,100 | $298,600 |
| 2023 | $3,625 | $318,500 | $43,700 | $274,800 |
| 2022 | $3,532 | $307,300 | $41,900 | $265,400 |
| 2021 | $3,240 | $280,700 | $37,800 | $242,900 |
| 2020 | $3,086 | $265,000 | $37,800 | $227,200 |
| 2019 | $2,982 | $252,700 | $35,500 | $217,200 |
| 2018 | $2,916 | $246,800 | $35,500 | $211,300 |
| 2017 | $2,323 | $232,300 | $33,500 | $198,800 |
| 2016 | $2,261 | $226,100 | $33,500 | $192,600 |
| 2014 | $2,074 | $207,400 | $30,400 | $177,000 |
| 2013 | $2,093 | $209,300 | $30,400 | $178,900 |
Source: Public Records
Map
Nearby Homes
- 8532 Charlotte Ct
- 793 Port Dr
- 8505 E County Road 100 N
- 958 Kitner Ave
- 546 Corbin Way
- 729 N County Road 900 E
- 811 Stone Trace Ct
- 8626 Golden Falls Cir
- 8405 Anderson Cir
- 1189 Kinross Dr
- 486 Hyannis Dr
- 1451 Red Dunes Run
- 1218 Bedford Dr
- 8287 Falkirk Dr
- 8178 Captain Dr
- 8607 Redditch Dr
- 578 Corbin Way
- 439 Dylan Dr
- 570 Corbin Way
- 8275 Locke Cir
- 8496 Charleston Ct
- 8530 Charleston Ct
- 8531 Charlotte Ct
- 8542 Charleston Ct
- 8482 Charleston Ct
- 8541 Charlotte Ct
- 8517 Charleston Ct
- 8503 Charleston Ct
- 8527 Charlotte Ct
- 8533 Charleston Ct
- 8487 Charleston Ct
- 8560 Charleston Ct
- 8547 Charleston Ct
- 8561 Charlotte Ct
- 8472 Charleston Ct
- 8475 Charleston Ct
- 926 Carolina Way
- 8544 Charlotte Ct
- 883 Columbia Ct
- 885 Columbia Ct