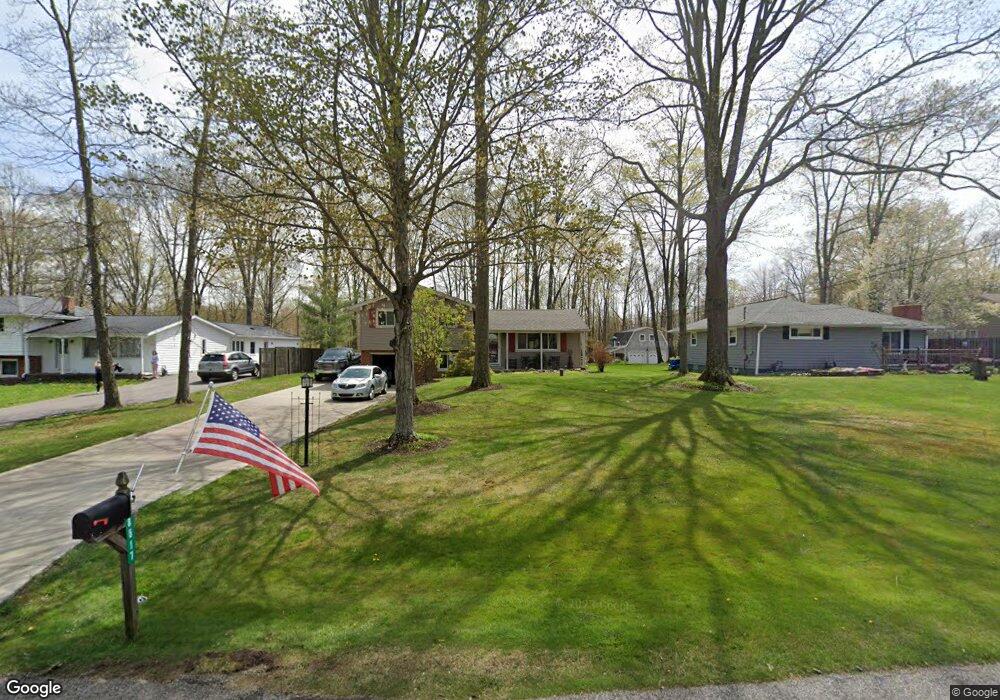
8517 Sharp Ln Chesterland, OH 44026
Estimated Value: $278,000 - $302,000
3
Beds
2
Baths
1,350
Sq Ft
$212/Sq Ft
Est. Value
About This Home
This home is located at 8517 Sharp Ln, Chesterland, OH 44026 and is currently estimated at $286,007, approximately $211 per square foot. 8517 Sharp Ln is a home located in Geauga County with nearby schools including West Geauga High School.
Ownership History
Date
Name
Owned For
Owner Type
Purchase Details
Closed on
Dec 11, 1998
Sold by
Kleinsorge Gerald G and Moore Joyce F
Bought by
Heidenreich Mark A and Heilinger Dana M
Current Estimated Value
Home Financials for this Owner
Home Financials are based on the most recent Mortgage that was taken out on this home.
Original Mortgage
$125,850
Interest Rate
6.96%
Purchase Details
Closed on
Jul 1, 1985
Bought by
Kleinsorge Gerald G
Create a Home Valuation Report for This Property
The Home Valuation Report is an in-depth analysis detailing your home's value as well as a comparison with similar homes in the area
Home Values in the Area
Average Home Value in this Area
Purchase History
| Date | Buyer | Sale Price | Title Company |
|---|---|---|---|
| Heidenreich Mark A | $132,500 | Geauga Title Insurance Agenc | |
| Kleinsorge Gerald G | $67,500 | -- |
Source: Public Records
Mortgage History
| Date | Status | Borrower | Loan Amount |
|---|---|---|---|
| Previous Owner | Heidenreich Mark A | $125,850 |
Source: Public Records
Tax History
| Year | Tax Paid | Tax Assessment Tax Assessment Total Assessment is a certain percentage of the fair market value that is determined by local assessors to be the total taxable value of land and additions on the property. | Land | Improvement |
|---|---|---|---|---|
| 2025 | $3,862 | $85,720 | $12,850 | $72,870 |
| 2024 | $3,862 | $85,720 | $12,850 | $72,870 |
| 2023 | $3,697 | $85,720 | $12,850 | $72,870 |
| 2022 | $3,094 | $61,530 | $10,710 | $50,820 |
| 2021 | $3,084 | $61,530 | $10,710 | $50,820 |
| 2020 | $3,206 | $61,530 | $10,710 | $50,820 |
| 2019 | $2,961 | $54,920 | $10,710 | $44,210 |
| 2018 | $2,937 | $54,920 | $10,710 | $44,210 |
| 2017 | $2,961 | $54,920 | $10,710 | $44,210 |
| 2016 | $3,132 | $54,920 | $10,260 | $44,660 |
| 2015 | $2,900 | $54,920 | $10,260 | $44,660 |
| 2014 | $2,900 | $54,920 | $10,260 | $44,660 |
| 2013 | $2,921 | $54,920 | $10,260 | $44,660 |
Source: Public Records
Map
Nearby Homes
- 8367 Kirkwood Dr
- 10831 Chillicothe Rd
- 10900 Angela Dr
- 10899 Tibbetts Rd
- 10405 Chillicothe Rd
- V/L Dewey Rd
- 7885 Pear Tree Dr
- 7425 Mulberry Rd
- 7454 Euclid Chardon Rd
- 8583 Sherman Rd
- 8593 Sherman Rd
- 8301 Sherman Rd
- 10548 Briar Hill Dr
- 11765 Sherwood Trail
- 9735 Deerfield Place
- 12420 Falcon Ridge Rd
- 9735 Chillicothe Rd
- 9735 Chillicothe Rd Unit 54
- 9735 Chillicothe Rd Unit 29
- 9735 Chillicothe Rd Unit 30
Your Personal Tour Guide
Ask me questions while you tour the home.