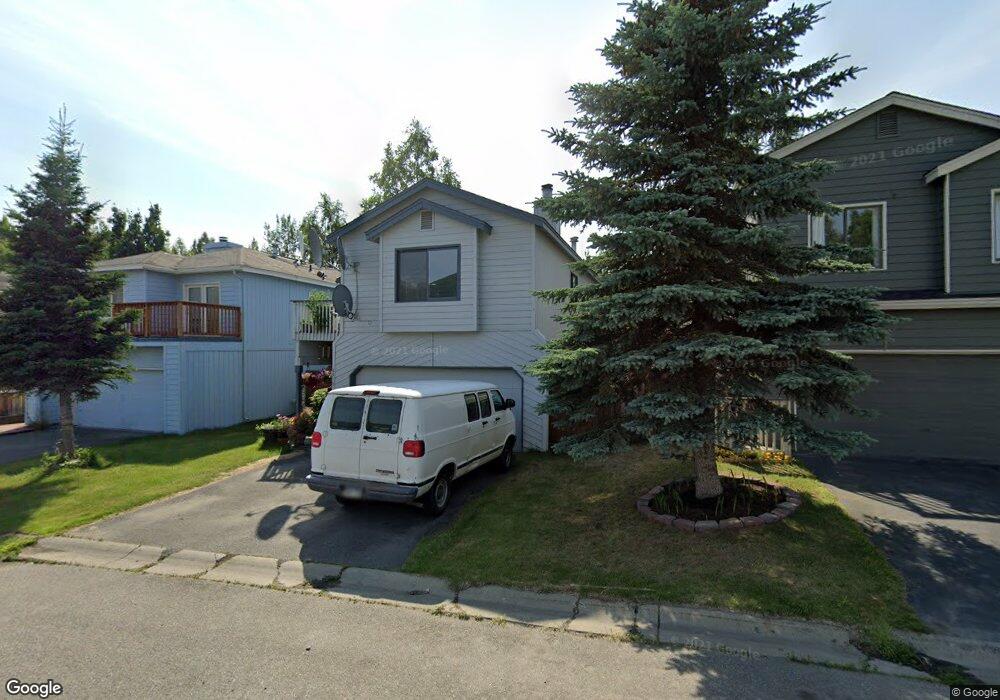
8518 Cross Pointe Loop Anchorage, AK 99504
Northeast Anchorage NeighborhoodEstimated Value: $253,000 - $412,068
4
Beds
2
Baths
1,870
Sq Ft
$178/Sq Ft
Est. Value
About This Home
This home is located at 8518 Cross Pointe Loop, Anchorage, AK 99504 and is currently estimated at $332,017, approximately $177 per square foot. 8518 Cross Pointe Loop is a home located in Anchorage Municipality with nearby schools including Muldoon Elementary School, Nicholas J. Begich Middle School, and Bartlett High School.
Ownership History
Date
Name
Owned For
Owner Type
Purchase Details
Closed on
Aug 30, 2005
Sold by
Lim Sam K and Lim Una
Bought by
Lim Una
Current Estimated Value
Home Financials for this Owner
Home Financials are based on the most recent Mortgage that was taken out on this home.
Original Mortgage
$188,000
Outstanding Balance
$108,348
Interest Rate
7.52%
Mortgage Type
Purchase Money Mortgage
Estimated Equity
$223,669
Purchase Details
Closed on
Feb 15, 2002
Sold by
Martin Werner B and Martin Kimberly N
Bought by
Lim Sam K and Lim Una
Purchase Details
Closed on
Mar 6, 1998
Sold by
Triplett James E
Bought by
Martin Werner B and Martin Kimberly N
Purchase Details
Closed on
Sep 23, 1991
Sold by
Tj Homes Inc
Bought by
Triplett James E
Home Financials for this Owner
Home Financials are based on the most recent Mortgage that was taken out on this home.
Original Mortgage
$98,610
Interest Rate
9.36%
Mortgage Type
FHA
Purchase Details
Closed on
Jun 12, 1991
Sold by
Lh Construction Inc
Bought by
Tj Homes Inc
Home Financials for this Owner
Home Financials are based on the most recent Mortgage that was taken out on this home.
Original Mortgage
$94,350
Interest Rate
9.56%
Mortgage Type
New Conventional
Create a Home Valuation Report for This Property
The Home Valuation Report is an in-depth analysis detailing your home's value as well as a comparison with similar homes in the area
Home Values in the Area
Average Home Value in this Area
Purchase History
| Date | Buyer | Sale Price | Title Company |
|---|---|---|---|
| Lim Una | -- | Alyeska Title Guaranty Agenc | |
| Lim Sam K | -- | First American Title | |
| Martin Werner B | -- | -- | |
| Martin Werner B | -- | -- | |
| Triplett James E | -- | -- | |
| Tj Homes Inc | -- | -- |
Source: Public Records
Mortgage History
| Date | Status | Borrower | Loan Amount |
|---|---|---|---|
| Open | Lim Una | $188,000 | |
| Previous Owner | Triplett James E | $98,610 | |
| Previous Owner | Tj Homes Inc | $94,350 | |
| Closed | Martin Werner B | $0 | |
| Closed | Lim Una | $47,000 |
Source: Public Records
Tax History
| Year | Tax Paid | Tax Assessment Tax Assessment Total Assessment is a certain percentage of the fair market value that is determined by local assessors to be the total taxable value of land and additions on the property. | Land | Improvement |
|---|---|---|---|---|
| 2025 | $2,542 | $386,000 | $83,200 | $302,800 |
| 2024 | $2,346 | $370,300 | $83,200 | $287,100 |
| 2023 | $5,714 | $335,500 | $83,200 | $252,300 |
| 2022 | $2,253 | $333,800 | $83,200 | $250,600 |
| 2021 | $5,305 | $294,400 | $83,200 | $211,200 |
| 2020 | $1,709 | $301,700 | $83,200 | $218,500 |
| 2019 | $1,507 | $292,100 | $83,200 | $208,900 |
| 2018 | $1,287 | $278,500 | $62,700 | $215,800 |
| 2017 | $1,685 | $277,600 | $62,700 | $214,900 |
| 2016 | $3,995 | $278,700 | $60,100 | $218,600 |
| 2015 | $3,995 | $279,300 | $60,100 | $219,200 |
| 2014 | $3,995 | $274,200 | $60,100 | $214,100 |
Source: Public Records
Map
Nearby Homes
- 8512 Cross Pointe Loop
- 8510 Moss Ct
- 1201 Boston St
- 1011 Friendly Ln
- 1541 State St Unit B-3
- 1542 Northview Dr Unit E8
- 1542 Northview Dr Unit E5
- 1801 Greendale Dr
- 4430 View Ct Unit 1
- 8330 E 5th Ave
- 7847 Old Harbor Ave
- 1477 Shallow Pool Dr Unit J3
- 1482 Shallow Pool Dr Unit M3
- 8510 Hidden View Ct
- 705 Muldoon Rd Unit 187
- 705 Muldoon Rd Unit 180
- 420 Cherry St
- 1900 Muldoon Rd
- 332 Gaylene Cir
- 8421 Duben Ave Unit 16
- 8524 Cross Pointe Loop
- 8530 Cross Pointe Loop
- 8506 Cross Pointe Loop
- 8441 Ryoaks Place
- 8536 Cross Pointe Loop
- 8871 Cross Pointe Loop
- 8500 Cross Pointe Loop
- 8440 Ryoaks Place
- 8867 Cross Pointe Loop
- 8870 Cross Pointe Loop
- 8531 Cross Pointe Loop
- 1311 Farrow Cir
- 8542 Cross Pointe Loop
- 8863 Cross Pointe Loop
- 8430 Ryoaks Place
- 8537 Cross Pointe Loop
- 8864 Cross Pointe Loop
- 8859 Cross Pointe Loop
- 8548 Cross Pointe Loop
- 8543 Cross Pointe Loop
Your Personal Tour Guide
Ask me questions while you tour the home.