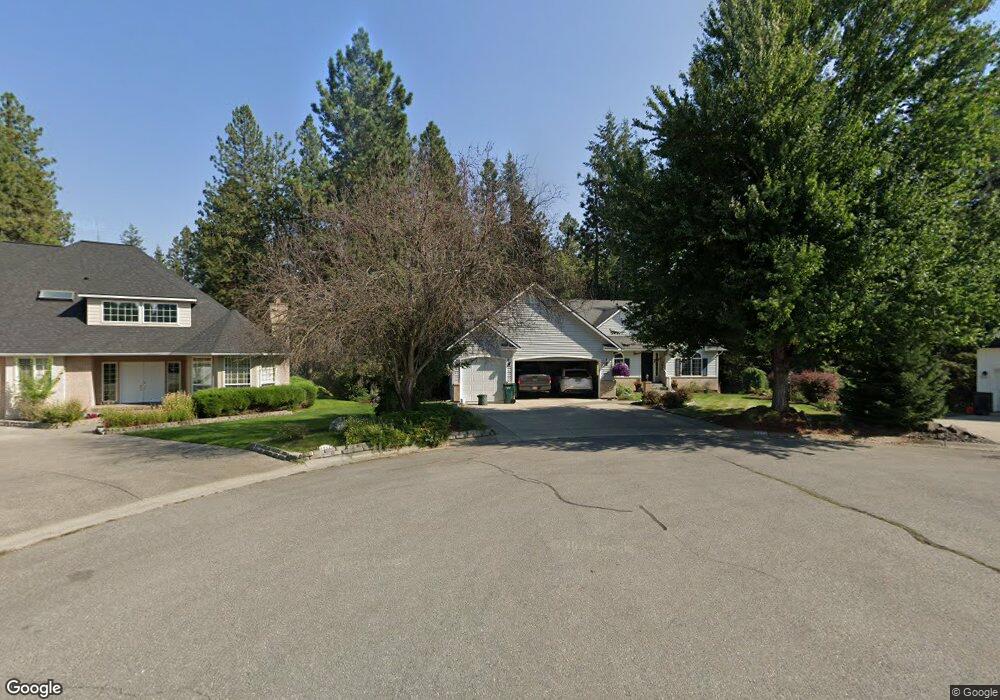
8519 N Stone Haven Dr Hayden, ID 83835
Estimated Value: $582,084 - $669,000
3
Beds
3
Baths
2,164
Sq Ft
$284/Sq Ft
Est. Value
About This Home
This home is located at 8519 N Stone Haven Dr, Hayden, ID 83835 and is currently estimated at $613,521, approximately $283 per square foot. 8519 N Stone Haven Dr is a home located in Kootenai County with nearby schools including Dalton Elementary School, Canfield Middle School, and Coeur d'Alene High School.
Ownership History
Date
Name
Owned For
Owner Type
Purchase Details
Closed on
Sep 30, 2015
Sold by
Jones Charles C and Szulman Jones Marilyn
Bought by
Jones Sharon Lee and Charyl Ann Jones Gst Exempt Trust
Current Estimated Value
Purchase Details
Closed on
Dec 30, 2009
Sold by
Jones James C
Bought by
Jones Charles C and Szulman Jones Marilyn
Create a Home Valuation Report for This Property
The Home Valuation Report is an in-depth analysis detailing your home's value as well as a comparison with similar homes in the area
Home Values in the Area
Average Home Value in this Area
Purchase History
| Date | Buyer | Sale Price | Title Company |
|---|---|---|---|
| Jones Sharon Lee | -- | None Available | |
| Jones Charles C | -- | -- |
Source: Public Records
Tax History Compared to Growth
Tax History
| Year | Tax Paid | Tax Assessment Tax Assessment Total Assessment is a certain percentage of the fair market value that is determined by local assessors to be the total taxable value of land and additions on the property. | Land | Improvement |
|---|---|---|---|---|
| 2025 | $2,790 | $539,180 | $250,000 | $289,180 |
| 2024 | $2,790 | $490,260 | $200,000 | $290,260 |
| 2023 | $2,790 | $526,383 | $210,000 | $316,383 |
| 2022 | $2,996 | $564,604 | $225,000 | $339,604 |
| 2021 | $2,840 | $399,039 | $160,000 | $239,039 |
| 2020 | $2,508 | $308,862 | $130,008 | $178,854 |
| 2019 | $2,993 | $272,041 | $113,050 | $158,991 |
| 2018 | $3,413 | $257,100 | $119,000 | $138,100 |
| 2017 | $3,512 | $244,960 | $108,000 | $136,960 |
| 2016 | $2,428 | $219,980 | $90,000 | $129,980 |
| 2015 | $1,236 | $219,180 | $82,500 | $136,680 |
| 2013 | $1,110 | $185,150 | $60,000 | $125,150 |
Source: Public Records
Map
Nearby Homes
- 8385 N Selkirk Ct
- 8323 N Tartan Dr
- 1280 Glenmore Ct
- 985 E Loch Lomond Ct
- 769 E Southwood Ct
- 8562 N Audubon Dr
- 1268 E Woodstone Ct
- 8351 N Audubon Dr
- 8318 N Village Dr Unit 2
- 8204 N Ridgewood Dr Unit 6
- NKA E Hayden Lake Rd
- 2484 E Woodstone Dr
- 1692 E Pebblestone Ct
- 2060 E Woodstone Dr
- 623 E Maple Place
- 536 E Cloverleaf Dr
- 8698 N Woodvine Dr
- 494 E Parkside Dr
- 9345 N Secretariat Ln
- 7728 N 15th St
- 8519 N Stonehaven Dr
- 8505 N Stone Haven Dr
- 8505 Stonehaven Dr
- 8512 N Uplands Dr
- 8482 N Uplands Dr
- 1287 E Loch Haven Dr
- 1265 E Loch Haven Dr
- 8477 N Stone Haven Dr
- 8514 N Stonehaven Dr
- 8514 N Stone Haven Dr
- 8490 N Stonehaven Dr
- 8446 N Uplands Dr
- 1317 E Loch Haven Dr
- 8472 N Stone Haven Dr
- 8472 Stonehaven Dr
- 8449 N Stone Haven Dr
- 1335 Loch Haven Dr
- 8414 N Uplands Dr
- 8450 Stonehaven Dr
- 8450 N Stone Haven Dr