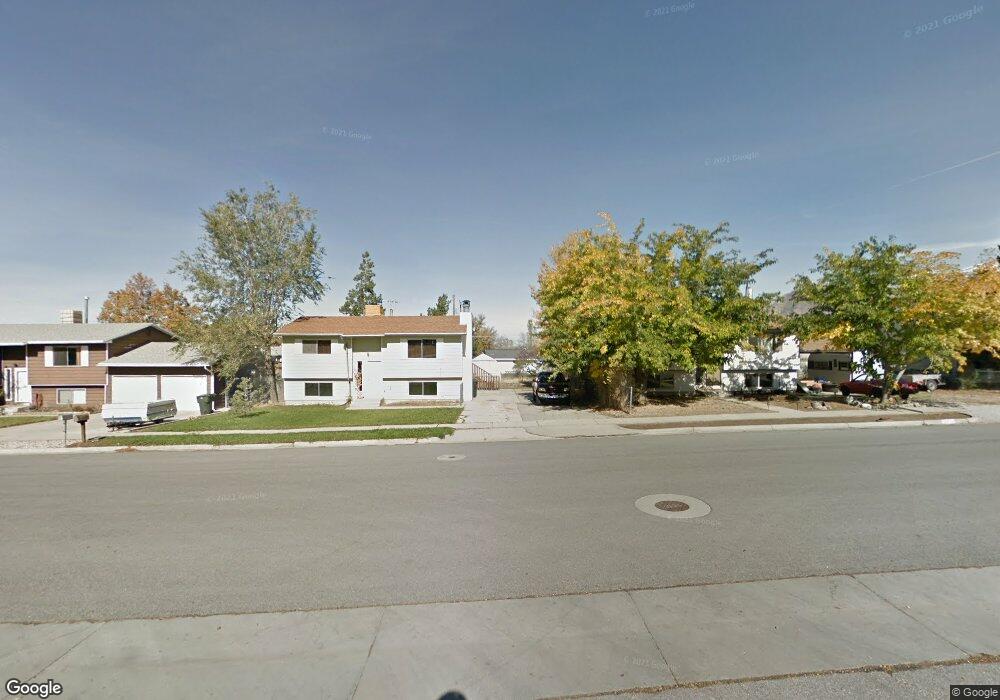
852 E 470 N Tooele, UT 84074
Estimated Value: $378,000 - $443,000
2
Beds
1
Bath
2,042
Sq Ft
$197/Sq Ft
Est. Value
About This Home
This home is located at 852 E 470 N, Tooele, UT 84074 and is currently estimated at $401,917, approximately $196 per square foot. 852 E 470 N is a home located in Tooele County with nearby schools including Sterling Elementary School, Tooele Junior High School, and Tooele High School.
Ownership History
Date
Name
Owned For
Owner Type
Purchase Details
Closed on
Jun 25, 2018
Sold by
Weber Weber C and Weber Kathy
Bought by
Desimon Dalton
Current Estimated Value
Home Financials for this Owner
Home Financials are based on the most recent Mortgage that was taken out on this home.
Original Mortgage
$239,641
Outstanding Balance
$207,548
Interest Rate
4.75%
Mortgage Type
FHA
Estimated Equity
$194,369
Purchase Details
Closed on
Nov 29, 2011
Sold by
Fannie Mae
Bought by
Weber David C and Weber Kathy A
Home Financials for this Owner
Home Financials are based on the most recent Mortgage that was taken out on this home.
Original Mortgage
$115,650
Interest Rate
4.06%
Mortgage Type
New Conventional
Purchase Details
Closed on
Jun 8, 2011
Sold by
Jackson Aaron
Bought by
Fannie Mae
Create a Home Valuation Report for This Property
The Home Valuation Report is an in-depth analysis detailing your home's value as well as a comparison with similar homes in the area
Purchase History
| Date | Buyer | Sale Price | Title Company |
|---|---|---|---|
| Desimon Dalton | -- | Security Title Insurance Age | |
| Weber David C | -- | Empire Land Title Inc | |
| Fannie Mae | $144,784 | Inwest Title Services Salt L |
Source: Public Records
Mortgage History
| Date | Status | Borrower | Loan Amount |
|---|---|---|---|
| Open | Desimon Dalton | $239,641 | |
| Previous Owner | Weber David C | $115,650 |
Source: Public Records
Tax History
| Year | Tax Paid | Tax Assessment Tax Assessment Total Assessment is a certain percentage of the fair market value that is determined by local assessors to be the total taxable value of land and additions on the property. | Land | Improvement |
|---|---|---|---|---|
| 2025 | $2,382 | $361,199 | $105,000 | $256,199 |
| 2024 | $2,532 | $193,247 | $57,750 | $135,497 |
| 2023 | $2,532 | $204,924 | $54,996 | $149,928 |
| 2022 | $2,380 | $204,785 | $55,000 | $149,785 |
| 2021 | $1,907 | $137,219 | $22,000 | $115,219 |
| 2020 | $1,832 | $228,729 | $40,000 | $188,729 |
| 2019 | $1,723 | $211,572 | $40,000 | $171,572 |
| 2018 | $1,088 | $174,041 | $40,000 | $134,041 |
| 2017 | $1,014 | $186,489 | $20,000 | $166,489 |
| 2016 | $1,090 | $90,625 | $11,000 | $79,625 |
| 2015 | $1,090 | $79,302 | $0 | $0 |
| 2014 | -- | $79,302 | $0 | $0 |
Source: Public Records
Map
Nearby Homes
- 847 Uintah Ave
- 812 E 500 N
- 792 E 540 N
- 347 Antelope Ave
- 614 Wasatch Ave
- 211 N 630 E
- 603 Valley View Dr
- 465 E 400 N
- 453 E 400 N
- 535 E 670 N
- 264 N 5th St
- 828 E Vine St
- 1266 E 850 N
- 208 E 850 N Unit A
- 224 E 850 N St Unit A
- 224 E 850 N Unit D
- 208 E 850 N Unit C
- 238 E 850 St N Unit D
- 19 S 820 E
- 11 Quebec Cir
- 852 Bonneville Way
- 862 E Bonneville Way
- 862 Bonneville Way
- 842 E 470 N
- 857 Uintah Ave
- 867 Uintah Ave
- 1011 Bonneville Way
- 478 Plateau Rd
- 823 Uintah Ave
- 830 Bonneville Way
- 855 Bonneville Way
- 454 N 880 E
- 444 N 880 E
- 813 Uintah Ave
- 479 Plateau Rd
- 492 Plateau Rd
- 434 N 880 E
- 464 N 880 E
- 865 N 470 E
- 822 Bonneville Way
Your Personal Tour Guide
Ask me questions while you tour the home.