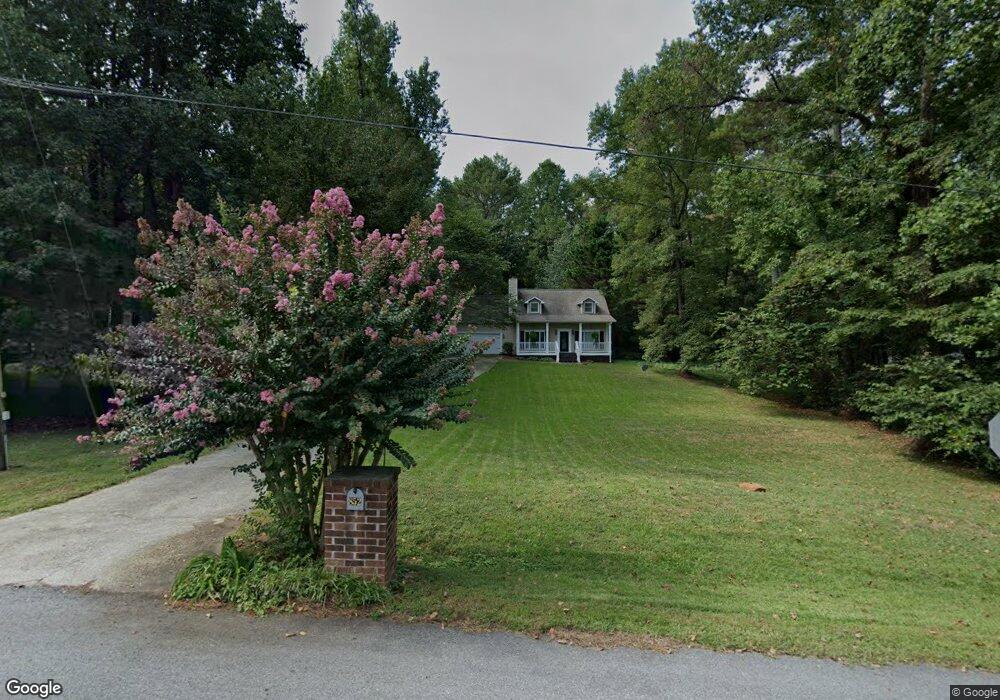
852 Georgetown Dr Unit 3 Winder, GA 30680
Estimated Value: $345,407 - $358,000
4
Beds
2
Baths
1,531
Sq Ft
$228/Sq Ft
Est. Value
About This Home
This home is located at 852 Georgetown Dr Unit 3, Winder, GA 30680 and is currently estimated at $349,102, approximately $228 per square foot. 852 Georgetown Dr Unit 3 is a home located in Barrow County with nearby schools including Bramlett Elementary School, Russell Middle School, and Winder-Barrow High School.
Ownership History
Date
Name
Owned For
Owner Type
Purchase Details
Closed on
Dec 10, 2010
Sold by
Hud-Housing Of Urban Dev
Bought by
Cronic Stephanie M
Current Estimated Value
Home Financials for this Owner
Home Financials are based on the most recent Mortgage that was taken out on this home.
Original Mortgage
$49,999
Outstanding Balance
$32,696
Interest Rate
4.25%
Mortgage Type
FHA
Estimated Equity
$316,406
Purchase Details
Closed on
Nov 3, 2009
Sold by
Citimortgage
Bought by
Hud-Housing Of Urban Dev
Purchase Details
Closed on
Jul 12, 2002
Sold by
Chaffin Lewis C and Chaffin Loriann L
Bought by
Her Naly
Home Financials for this Owner
Home Financials are based on the most recent Mortgage that was taken out on this home.
Original Mortgage
$116,280
Interest Rate
6.67%
Mortgage Type
New Conventional
Purchase Details
Closed on
Dec 7, 1990
Bought by
Chaffin Lewis C Jr A
Create a Home Valuation Report for This Property
The Home Valuation Report is an in-depth analysis detailing your home's value as well as a comparison with similar homes in the area
Home Values in the Area
Average Home Value in this Area
Purchase History
| Date | Buyer | Sale Price | Title Company |
|---|---|---|---|
| Cronic Stephanie M | -- | -- | |
| Cronic Stephanie M | -- | -- | |
| Hud-Housing Of Urban Dev | -- | -- | |
| Citimortgage | $144,659 | -- | |
| Her Naly | $114,000 | -- | |
| Chaffin Lewis C Jr A | $11,000 | -- |
Source: Public Records
Mortgage History
| Date | Status | Borrower | Loan Amount |
|---|---|---|---|
| Open | Cronic Stephanie M | $49,999 | |
| Closed | Cronic Stephanie M | $49,999 | |
| Previous Owner | Her Naly | $116,280 |
Source: Public Records
Tax History
| Year | Tax Paid | Tax Assessment Tax Assessment Total Assessment is a certain percentage of the fair market value that is determined by local assessors to be the total taxable value of land and additions on the property. | Land | Improvement |
|---|---|---|---|---|
| 2025 | $1,380 | $59,629 | $16,000 | $43,629 |
| 2024 | $1,388 | $58,459 | $16,000 | $42,459 |
| 2023 | $980 | $58,859 | $16,000 | $42,859 |
| 2022 | $1,342 | $49,499 | $16,000 | $33,499 |
| 2021 | $1,409 | $49,499 | $16,000 | $33,499 |
| 2020 | $1,409 | $49,499 | $16,000 | $33,499 |
| 2019 | $1,433 | $49,499 | $16,000 | $33,499 |
| 2018 | $1,262 | $44,594 | $12,600 | $31,994 |
| 2017 | $1,137 | $39,050 | $12,600 | $26,450 |
| 2016 | $1,037 | $38,141 | $12,600 | $25,541 |
| 2015 | $1,062 | $38,802 | $12,600 | $26,202 |
| 2014 | $879 | $32,707 | $6,174 | $26,533 |
| 2013 | -- | $31,493 | $6,174 | $25,319 |
Source: Public Records
Map
Nearby Homes
- 912 Westwood Ln
- 817 Brookside Dr
- 103 Treemont Way
- 1224 Treemont Trace
- 1929 Windstone Place
- 1303 Windstone Ct
- 1000 Jim Johnson Rd
- 681 County Line Auburn Rd
- 604 Fox Run
- 807 Kenwood Ln
- 1136 Lexington Ridge Rd
- 1022 Cyperts Trail
- 0 Covered Bridge Rd Unit 10700765
- 903 Carl Bramlett Rd
- 687 Ansley Ct
- 321 Bear Way
- 177 Deer Canyon Dr
- 234 Pecks Ct
- 153 Deer Canyon Dr
- 21 Rocky Ridge Way
- 850 Georgetown Dr Unit 3
- 854 Georgetown Dr
- 848 Georgetown Dr
- 856 Georgetown Dr Unit 3
- 856 Georgetown Dr
- 856 Governors Ln
- 855 Governors Ln
- 846 Georgetown Dr Unit 3
- 858 Georgetown Dr
- 847 Georgetown Dr
- 847 Georgetown Dr Unit 3
- 859 Georgetown Dr
- 858 Governors Ln
- 844 Georgetown Dr Unit 1
- 860 Georgetown Dr
- 842 Potomac Place Unit 1
- 857 Governors Ln
- 844 Potomac Place Unit 1/Lot 50
- 842 Georgetown Dr Unit 1
- 862 Georgetown Dr
Your Personal Tour Guide
Ask me questions while you tour the home.