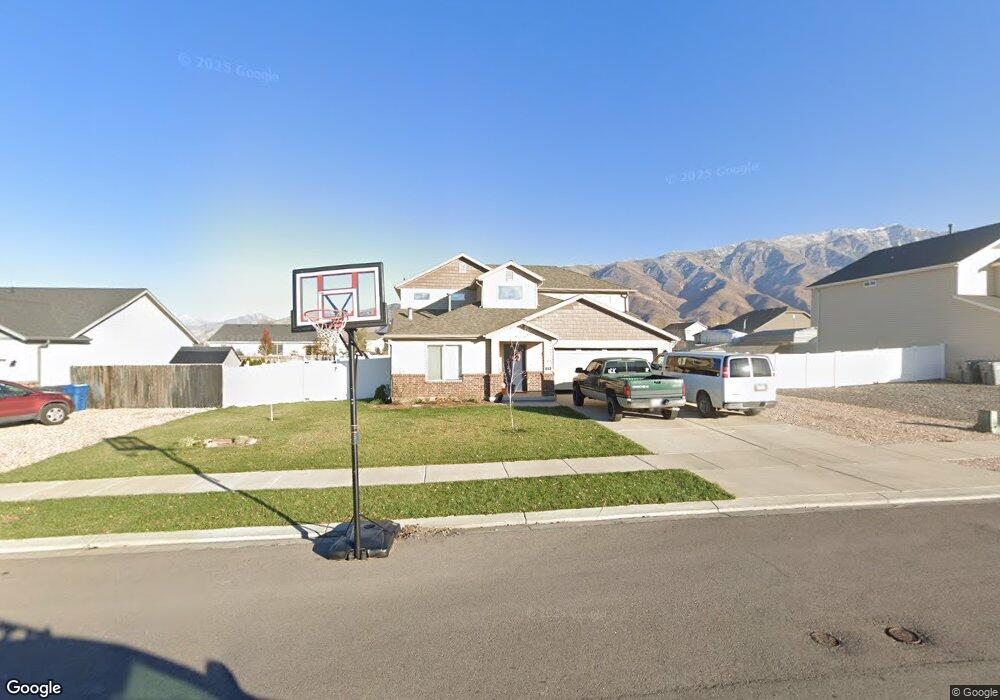
852 N 420 W Unit 37 Santaquin, UT 84655
Estimated Value: $487,388 - $535,000
3
Beds
3
Baths
3,126
Sq Ft
$166/Sq Ft
Est. Value
About This Home
This home is located at 852 N 420 W Unit 37, Santaquin, UT 84655 and is currently estimated at $518,597, approximately $165 per square foot. 852 N 420 W Unit 37 is a home located in Utah County with nearby schools including Apple Valley Elementary, Payson Junior High School, and Payson High School.
Ownership History
Date
Name
Owned For
Owner Type
Purchase Details
Closed on
Jan 30, 2019
Sold by
Griffiths Kristin and Vargas Rosa
Bought by
Mortensen Joseph and Mortensen Kate
Current Estimated Value
Home Financials for this Owner
Home Financials are based on the most recent Mortgage that was taken out on this home.
Original Mortgage
$290,515
Outstanding Balance
$255,415
Interest Rate
4.5%
Mortgage Type
New Conventional
Estimated Equity
$263,182
Purchase Details
Closed on
Dec 14, 2016
Sold by
Cox Jeffey A and Cox Christa A
Bought by
Griffiths Kristin and Vargas Rosa
Home Financials for this Owner
Home Financials are based on the most recent Mortgage that was taken out on this home.
Original Mortgage
$250,381
Interest Rate
4.25%
Mortgage Type
FHA
Purchase Details
Closed on
May 5, 2016
Sold by
Westwood Bryce
Bought by
Cox Jeffrey A and Cox Christa A
Home Financials for this Owner
Home Financials are based on the most recent Mortgage that was taken out on this home.
Original Mortgage
$246,683
Interest Rate
3.71%
Mortgage Type
New Conventional
Purchase Details
Closed on
Jun 5, 2012
Sold by
Sierra Homes Construction Inc
Bought by
Westwood Bryce
Home Financials for this Owner
Home Financials are based on the most recent Mortgage that was taken out on this home.
Original Mortgage
$177,244
Interest Rate
3.84%
Mortgage Type
New Conventional
Purchase Details
Closed on
Mar 8, 2012
Sold by
Apple Cove Group Lllc
Bought by
Sierra Homes Construction Inc
Home Financials for this Owner
Home Financials are based on the most recent Mortgage that was taken out on this home.
Original Mortgage
$127,500
Interest Rate
3.92%
Mortgage Type
Construction
Purchase Details
Closed on
Aug 25, 2011
Sold by
Re Investments Llc
Bought by
Apple Cove Group Llc
Home Financials for this Owner
Home Financials are based on the most recent Mortgage that was taken out on this home.
Original Mortgage
$190,000
Interest Rate
4.48%
Mortgage Type
Future Advance Clause Open End Mortgage
Purchase Details
Closed on
Apr 25, 2011
Sold by
Federal Deposit Insurance Corporation
Bought by
Re Investments Llc
Create a Home Valuation Report for This Property
The Home Valuation Report is an in-depth analysis detailing your home's value as well as a comparison with similar homes in the area
Home Values in the Area
Average Home Value in this Area
Purchase History
| Date | Buyer | Sale Price | Title Company |
|---|---|---|---|
| Mortensen Joseph | -- | Provo Land Title Co | |
| Griffiths Kristin | -- | Inwest Title Services Inc | |
| Cox Jeffrey A | -- | Old Republic Title | |
| Westwood Bryce | -- | None Available | |
| Sierra Homes Construction Inc | -- | None Available | |
| Apple Cove Group Llc | -- | Select Title Insurance Agenc | |
| Re Investments Llc | -- | First American Ncs South Te |
Source: Public Records
Mortgage History
| Date | Status | Borrower | Loan Amount |
|---|---|---|---|
| Open | Mortensen Joseph | $290,515 | |
| Previous Owner | Griffiths Kristin | $250,381 | |
| Previous Owner | Cox Jeffrey A | $246,683 | |
| Previous Owner | Westwood Bryce | $177,244 | |
| Previous Owner | Sierra Homes Construction Inc | $127,500 | |
| Previous Owner | Apple Cove Group Llc | $190,000 | |
| Previous Owner | Apple Cove Group Llc | $120,000 |
Source: Public Records
Tax History Compared to Growth
Tax History
| Year | Tax Paid | Tax Assessment Tax Assessment Total Assessment is a certain percentage of the fair market value that is determined by local assessors to be the total taxable value of land and additions on the property. | Land | Improvement |
|---|---|---|---|---|
| 2025 | $2,175 | $243,705 | $142,800 | $300,300 |
| 2024 | $2,175 | $216,590 | $0 | $0 |
| 2023 | $2,294 | $229,130 | $0 | $0 |
| 2022 | $2,337 | $240,790 | $0 | $0 |
| 2021 | $2,006 | $320,400 | $80,500 | $239,900 |
| 2020 | $1,929 | $298,500 | $70,000 | $228,500 |
| 2019 | $1,698 | $268,700 | $70,000 | $198,700 |
| 2018 | $1,550 | $234,000 | $61,200 | $172,800 |
| 2017 | $1,499 | $120,890 | $0 | $0 |
| 2016 | $1,361 | $107,525 | $0 | $0 |
| 2015 | $1,351 | $104,720 | $0 | $0 |
| 2014 | $1,370 | $105,930 | $0 | $0 |
Source: Public Records
Map
Nearby Homes
- 358 W 910 N
- 931 N 215 W
- 951 N 215 W
- 949 N 215 W
- 947 N 215 W
- 953 N 215 W
- McIntosh Plan at The Orchards
- Honey Plan at The Orchards
- Cranford Plan at The Orchards
- Monroe Plan at The Orchards
- Benson Plan at The Orchards
- Gala Plan at The Orchards
- 162 W 690 N
- 109 W 930 N
- 894 N Apple Seed Ln
- 41 W 770 N
- 1032 N Apple Seed Ln
- 369 N 500 W Unit 3
- 600 N Center St
- 116 E 840 N