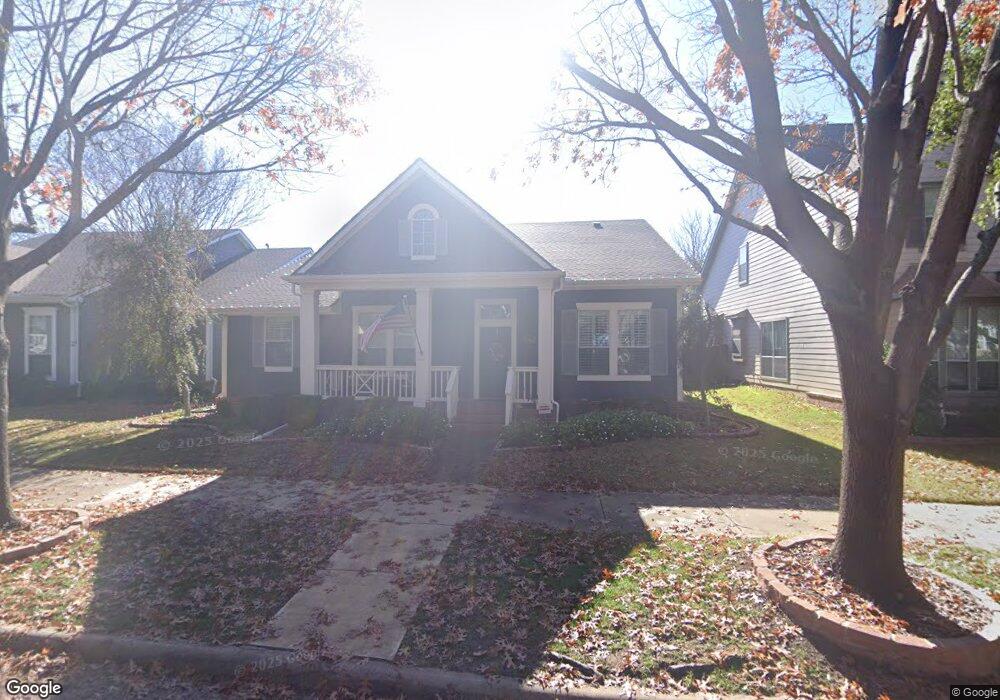
8520 Hudson St North Richland Hills, TX 76180
Estimated Value: $485,722 - $542,000
3
Beds
2
Baths
2,264
Sq Ft
$227/Sq Ft
Est. Value
About This Home
This home is located at 8520 Hudson St, North Richland Hills, TX 76180 and is currently estimated at $514,431, approximately $227 per square foot. 8520 Hudson St is a home located in Tarrant County with nearby schools including Walker Creek Elementary School, Smithfield Middle School, and Birdville High School.
Ownership History
Date
Name
Owned For
Owner Type
Purchase Details
Closed on
Sep 15, 2004
Sold by
Weekley Homes Lp
Bought by
Yim Paul and Yim Mary
Current Estimated Value
Home Financials for this Owner
Home Financials are based on the most recent Mortgage that was taken out on this home.
Original Mortgage
$165,000
Outstanding Balance
$81,550
Interest Rate
5.95%
Mortgage Type
Purchase Money Mortgage
Estimated Equity
$432,881
Create a Home Valuation Report for This Property
The Home Valuation Report is an in-depth analysis detailing your home's value as well as a comparison with similar homes in the area
Home Values in the Area
Average Home Value in this Area
Purchase History
| Date | Buyer | Sale Price | Title Company |
|---|---|---|---|
| Yim Paul | -- | Priority Title |
Source: Public Records
Mortgage History
| Date | Status | Borrower | Loan Amount |
|---|---|---|---|
| Open | Yim Paul | $165,000 |
Source: Public Records
Tax History Compared to Growth
Tax History
| Year | Tax Paid | Tax Assessment Tax Assessment Total Assessment is a certain percentage of the fair market value that is determined by local assessors to be the total taxable value of land and additions on the property. | Land | Improvement |
|---|---|---|---|---|
| 2025 | $3,400 | $448,820 | $61,030 | $387,790 |
| 2024 | $3,400 | $467,521 | $61,030 | $406,491 |
| 2023 | $9,341 | $461,858 | $61,030 | $400,828 |
| 2022 | $9,316 | $409,728 | $61,030 | $348,698 |
| 2021 | $8,955 | $351,933 | $75,000 | $276,933 |
| 2020 | $8,142 | $320,000 | $75,000 | $245,000 |
| 2019 | $8,427 | $320,000 | $75,000 | $245,000 |
| 2018 | $5,430 | $300,000 | $75,000 | $225,000 |
| 2017 | $7,976 | $330,489 | $75,000 | $255,489 |
| 2016 | $7,251 | $283,356 | $40,000 | $243,356 |
| 2015 | $5,458 | $245,000 | $40,000 | $205,000 |
| 2014 | $5,458 | $245,000 | $40,000 | $205,000 |
Source: Public Records
Map
Nearby Homes
- 8321 Bridge St
- 7800 Mockingbird Ln Unit 29
- 7800 Mockingbird Ln Unit 81
- 7800 Mockingbird Ln Unit 73
- 7800 Mockingbird Ln Unit 43
- 7800 Mockingbird Ln Unit 205
- 6001 Kessler Dr
- 6025 Kessler Dr
- 6008 Kessler Dr
- 8240 Bridge St
- 8908 Redding St
- 6008 Monterey Mews
- 6113 Cliffbrook Dr
- 6017 Avalon St
- 6124 Mayfair Mews
- 6105 Parker Blvd
- 6116 Morningside Dr
- 8765 Bridge St
- 8748 Morris Mews
- 6137 Marquita Mews