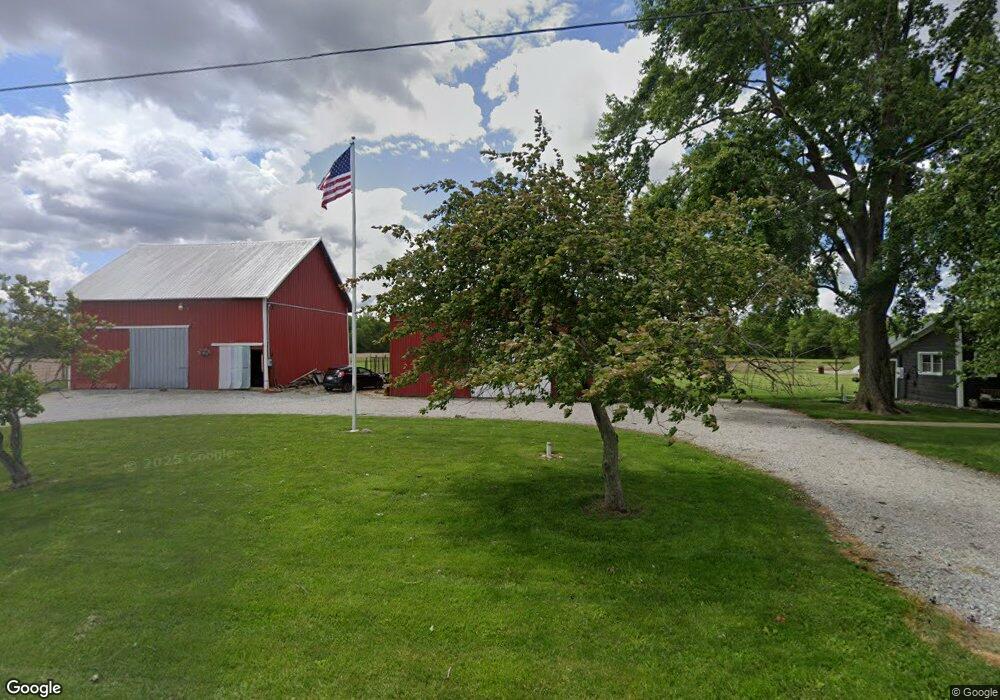
8521 E 1100 N Markleville, IN 46056
Estimated Value: $357,003 - $494,000
4
Beds
1
Bath
1,940
Sq Ft
$207/Sq Ft
Est. Value
About This Home
This home is located at 8521 E 1100 N, Markleville, IN 46056 and is currently estimated at $402,001, approximately $207 per square foot. 8521 E 1100 N is a home located in Hancock County with nearby schools including Eastern Hancock Elementary School, Eastern Hancock Middle School, and Eastern Hancock High School.
Ownership History
Date
Name
Owned For
Owner Type
Purchase Details
Closed on
Oct 4, 2019
Sold by
Dellekamp Joshua Michael
Bought by
Johnson Hunter L and Johnson Kristin J
Current Estimated Value
Home Financials for this Owner
Home Financials are based on the most recent Mortgage that was taken out on this home.
Original Mortgage
$245,337
Outstanding Balance
$212,058
Interest Rate
3.5%
Mortgage Type
VA
Estimated Equity
$189,943
Purchase Details
Closed on
Jun 18, 2015
Sold by
Gilbreath Stephen J
Bought by
Dellekamp Joshua Michael
Home Financials for this Owner
Home Financials are based on the most recent Mortgage that was taken out on this home.
Original Mortgage
$192,552
Interest Rate
0.78%
Mortgage Type
VA
Create a Home Valuation Report for This Property
The Home Valuation Report is an in-depth analysis detailing your home's value as well as a comparison with similar homes in the area
Purchase History
| Date | Buyer | Sale Price | Title Company |
|---|---|---|---|
| Johnson Hunter L | -- | Chicago Title Company Llc | |
| Dellekamp Joshua Michael | -- | None Available |
Source: Public Records
Mortgage History
| Date | Status | Borrower | Loan Amount |
|---|---|---|---|
| Open | Johnson Hunter L | $245,337 | |
| Previous Owner | Dellekamp Joshua Michael | $192,552 |
Source: Public Records
Tax History
| Year | Tax Paid | Tax Assessment Tax Assessment Total Assessment is a certain percentage of the fair market value that is determined by local assessors to be the total taxable value of land and additions on the property. | Land | Improvement |
|---|---|---|---|---|
| 2025 | $1,339 | $254,500 | $43,400 | $211,100 |
| 2024 | $1,339 | $246,500 | $44,000 | $202,500 |
| 2023 | $1,339 | $219,500 | $42,500 | $177,000 |
| 2022 | $1,325 | $203,700 | $34,400 | $169,300 |
| 2021 | $858 | $144,400 | $33,600 | $110,800 |
| 2020 | $890 | $144,400 | $33,600 | $110,800 |
| 2019 | $840 | $140,700 | $34,700 | $106,000 |
| 2018 | $828 | $139,600 | $34,900 | $104,700 |
| 2017 | $843 | $137,700 | $35,800 | $101,900 |
| 2016 | $798 | $135,800 | $35,700 | $100,100 |
| 2014 | $735 | $125,400 | $43,000 | $82,400 |
| 2013 | $735 | $124,200 | $41,800 | $82,400 |
Source: Public Records
Map
Nearby Homes
- 0 N Nashville Rd Unit MBR22064069
- 0 N Nashville Rd Unit LotWP001 24911804
- 0 E 575 S Unit MBR22077517
- 0 E 575 S Unit 26127953
- 0 E 575 S Unit 11621534
- 8847 S State Road 109
- 10939 S 400 E
- 2116 E State Road 38
- 0 E 1000 N Unit 11607696
- 119 W Main St
- 114 E Main St
- 9292 S Tomahawk Trail
- 600 E North St N
- 8202 S 300 E
- 115 W State Road 38
- 00 N Pennsylvania St
- 8498 S 150 W
- 7130 N Thomas Rd
- 00 W 100 Rd N
- 01 W 100 Rd N
- 8521 E 1100 N
- 775 E 1100 N
- 1320 E 1100 S
- 8816 E 1100 N
- 0 E 1100 Rd S Unit MBR21991518
- LOTS 28 & 29 County Road 1100 S
- 0 County Road 1100 S
- 10993 S State Road 109
- 10877 N State Road 109
- 10525 N 775 E
- 10446 S 100 E
- 10515 S State Road 109
- 10500 S State Road 109
- 10417 S State Road 109
- 10164 N State Road 109
- 10308 Indiana 109
- 10308 N State Road 109
- 10250 S State Road 109
- 1615 E 1000 S
- 10181 N State Road 109
Your Personal Tour Guide
Ask me questions while you tour the home.