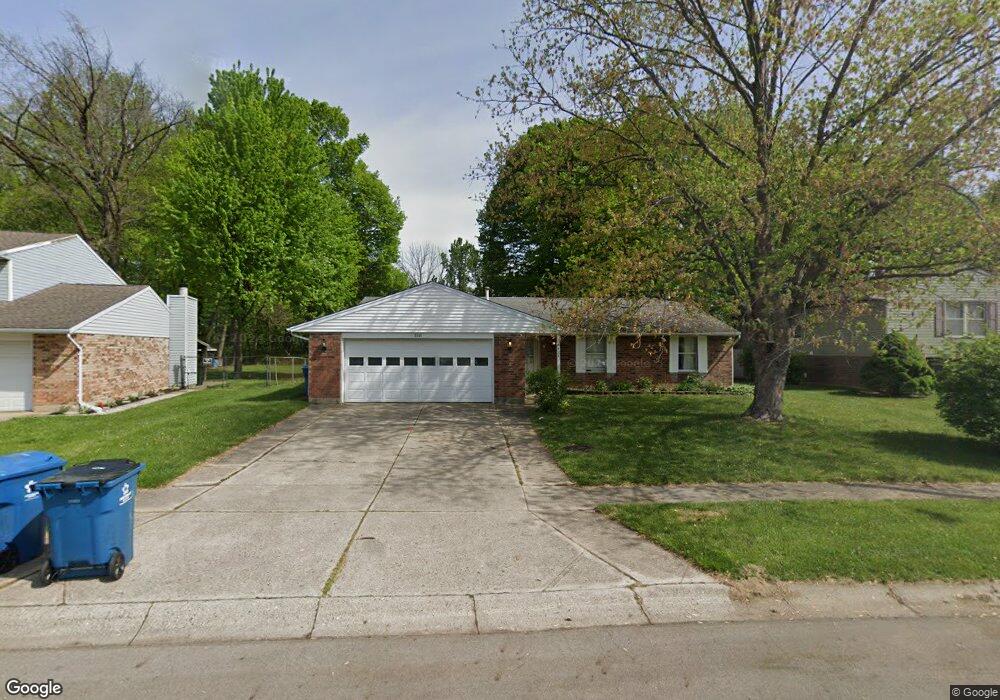
8521 Pinegate Way Dayton, OH 45424
Estimated Value: $230,234 - $254,000
3
Beds
2
Baths
1,509
Sq Ft
$161/Sq Ft
Est. Value
About This Home
This home is located at 8521 Pinegate Way, Dayton, OH 45424 and is currently estimated at $242,809, approximately $160 per square foot. 8521 Pinegate Way is a home located in Miami County with nearby schools including Bethel Elementary School, Bethel Middle School, and Bethel High School.
Ownership History
Date
Name
Owned For
Owner Type
Purchase Details
Closed on
Dec 10, 2015
Sold by
Paj Enderprises Llc
Bought by
Welch Erica L and Thomas Christopher B
Current Estimated Value
Home Financials for this Owner
Home Financials are based on the most recent Mortgage that was taken out on this home.
Original Mortgage
$121,500
Interest Rate
3.92%
Mortgage Type
New Conventional
Purchase Details
Closed on
Jun 13, 2001
Sold by
Hatfield James D and Hatfield Judith A
Bought by
Stark Jerry and Stark Patricia
Home Financials for this Owner
Home Financials are based on the most recent Mortgage that was taken out on this home.
Original Mortgage
$116,176
Interest Rate
7.22%
Mortgage Type
FHA
Purchase Details
Closed on
Jun 20, 1994
Sold by
Hatfield James D and Hatfield Judith A
Bought by
Hatfield James D and Hatfield Judith A
Create a Home Valuation Report for This Property
The Home Valuation Report is an in-depth analysis detailing your home's value as well as a comparison with similar homes in the area
Purchase History
| Date | Buyer | Sale Price | Title Company |
|---|---|---|---|
| Welch Erica L | $127,900 | Chicago Title Company Llc | |
| Stark Jerry | $117,000 | Title Pointe Agency Inc | |
| Hatfield James D | -- | -- |
Source: Public Records
Mortgage History
| Date | Status | Borrower | Loan Amount |
|---|---|---|---|
| Previous Owner | Welch Erica L | $121,500 | |
| Previous Owner | Stark Jerry | $116,176 |
Source: Public Records
Tax History
| Year | Tax Paid | Tax Assessment Tax Assessment Total Assessment is a certain percentage of the fair market value that is determined by local assessors to be the total taxable value of land and additions on the property. | Land | Improvement |
|---|---|---|---|---|
| 2025 | $3,423 | $62,580 | $14,910 | $47,670 |
| 2024 | $3,309 | $62,580 | $14,910 | $47,670 |
| 2023 | $3,309 | $62,580 | $14,910 | $47,670 |
| 2022 | $2,952 | $44,050 | $10,500 | $33,550 |
| 2021 | $2,997 | $44,050 | $10,500 | $33,550 |
| 2020 | $2,923 | $44,050 | $10,500 | $33,550 |
| 2019 | $2,762 | $36,770 | $10,500 | $26,270 |
| 2018 | $2,771 | $36,770 | $10,500 | $26,270 |
| 2017 | $2,753 | $36,770 | $10,500 | $26,270 |
| 2016 | $2,800 | $35,470 | $10,500 | $24,970 |
| 2015 | $2,691 | $35,470 | $10,500 | $24,970 |
| 2014 | $2,691 | $35,470 | $10,500 | $24,970 |
| 2012 | -- | $41,080 | $10,500 | $30,580 |
Source: Public Records
Map
Nearby Homes
- 8918 Autumngate Ln
- 6000 Timbergate Trail
- 8041 Bushclover Dr
- 5769 Waynegate Rd
- 8127 Bushclover Dr
- 8851 Cherrygate Ct
- 6070 Charlesgate Rd
- 5770 Charlesgate Rd
- 8871 Willowgate Ln
- 4704 Cobblestone Dr Unit 4704
- 5686 Firegate Ct
- 8190 Bushclover Dr
- 4606 Cobblestone Dr Unit 4606
- 2230 Blazing Star Dr
- 4618 Cobblestone Dr Unit 4618
- 6065 Shull Rd
- 4362 Bergamot Dr
- 5994 Shooting Star St
- 5184 Waterleaf Dr
- 4031 Redbud Way
- 8531 Pinegate Way
- 8511 Pinegate Way
- 8541 Pinegate Way
- 8507 Pinegate Way
- 8997 Hickorygate Ln
- 8998 Hickorygate Ln
- 8551 Pinegate Way
- 4870 Summerset Dr
- 5929 Waynegate Rd
- 4888 Summerset Dr
- 8994 Hickorygate Ln
- 8993 Hickorygate Ln
- 8500 Pinegate Way
- 4906 Summerset Dr
- 8561 Pinegate Way
- 8999 Cedargate Place
- 5919 Waynegate Rd
- 8990 Hickorygate Ln
- 8987 Hickorygate Ln
- 4922 Summerset Dr
Your Personal Tour Guide
Ask me questions while you tour the home.