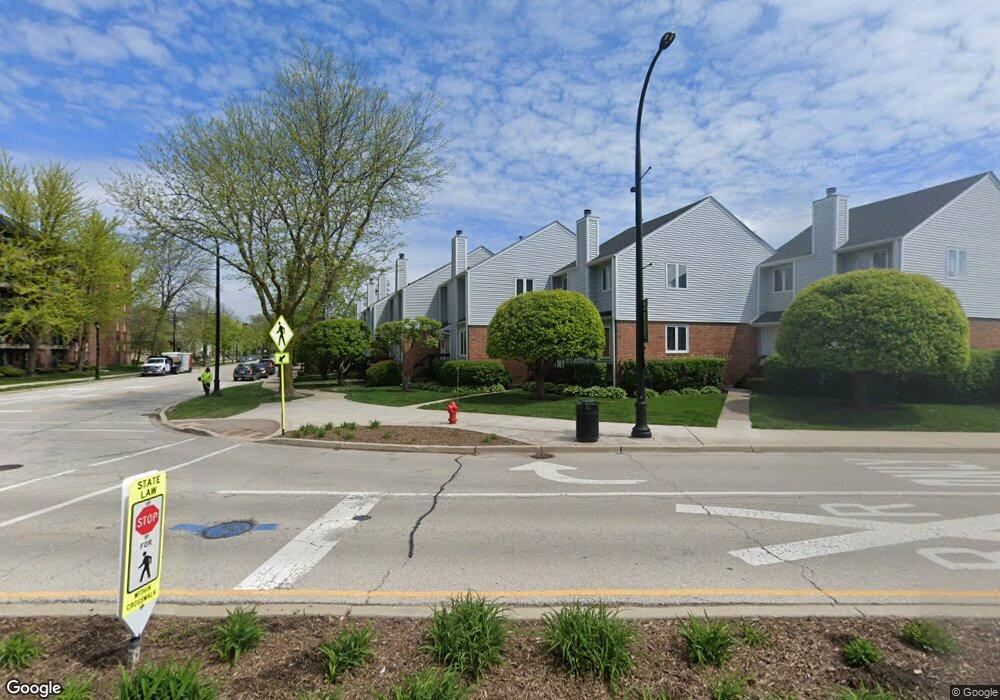
8523 Ferris Ave Unit 7 Morton Grove, IL 60053
Estimated Value: $308,832 - $340,000
2
Beds
--
Bath
14,000
Sq Ft
$23/Sq Ft
Est. Value
About This Home
This home is located at 8523 Ferris Ave Unit 7, Morton Grove, IL 60053 and is currently estimated at $324,958, approximately $23 per square foot. 8523 Ferris Ave Unit 7 is a home located in Cook County with nearby schools including Park View Elementary School, Niles West High School, and St John Brebeuf School.
Ownership History
Date
Name
Owned For
Owner Type
Purchase Details
Closed on
Mar 4, 2022
Sold by
Boyd Buff Rosen and Boyd Y
Bought by
Boyd Buff E Rosen and Buff E Rose Boyd Living Trust
Current Estimated Value
Purchase Details
Closed on
Nov 30, 2021
Sold by
Boyd Buff Rosen and Boyd Y
Bought by
Boyd Buff E Rosen and Buff E Rose Boyd Living Trust
Purchase Details
Closed on
Jun 4, 2001
Sold by
Ha Don and Marshall Ellen
Bought by
Boyd Buff Rosen
Home Financials for this Owner
Home Financials are based on the most recent Mortgage that was taken out on this home.
Original Mortgage
$167,000
Interest Rate
7.11%
Purchase Details
Closed on
Jun 29, 2000
Sold by
Fricke Robert W and Fricke Eiko
Bought by
Ha Donn and Marshall Ha Ellen
Home Financials for this Owner
Home Financials are based on the most recent Mortgage that was taken out on this home.
Original Mortgage
$180,500
Interest Rate
7.87%
Create a Home Valuation Report for This Property
The Home Valuation Report is an in-depth analysis detailing your home's value as well as a comparison with similar homes in the area
Home Values in the Area
Average Home Value in this Area
Purchase History
| Date | Buyer | Sale Price | Title Company |
|---|---|---|---|
| Boyd Buff E Rosen | -- | -- | |
| Boyd Buff E Rosen | -- | -- | |
| Boyd Buff E Rosen | -- | -- | |
| Boyd Buff Rosen | $209,000 | -- | |
| Ha Donn | -- | -- |
Source: Public Records
Mortgage History
| Date | Status | Borrower | Loan Amount |
|---|---|---|---|
| Previous Owner | Boyd Buff Rosen | $167,000 | |
| Previous Owner | Ha Donn | $180,500 |
Source: Public Records
Tax History Compared to Growth
Tax History
| Year | Tax Paid | Tax Assessment Tax Assessment Total Assessment is a certain percentage of the fair market value that is determined by local assessors to be the total taxable value of land and additions on the property. | Land | Improvement |
|---|---|---|---|---|
| 2024 | $5,572 | $23,895 | $3,778 | $20,117 |
| 2023 | $5,257 | $25,259 | $3,778 | $21,481 |
| 2022 | $5,257 | $25,259 | $3,778 | $21,481 |
| 2021 | $4,931 | $21,368 | $2,428 | $18,940 |
| 2020 | $4,928 | $21,368 | $2,428 | $18,940 |
| 2019 | $4,947 | $23,840 | $2,428 | $21,412 |
| 2018 | $4,921 | $21,780 | $2,091 | $19,689 |
| 2017 | $4,992 | $21,780 | $2,091 | $19,689 |
| 2016 | $5,244 | $21,780 | $2,091 | $19,689 |
| 2015 | $5,811 | $20,655 | $1,821 | $18,834 |
| 2014 | $5,949 | $21,048 | $1,821 | $19,227 |
| 2013 | $5,794 | $21,048 | $1,821 | $19,227 |
Source: Public Records
Map
Nearby Homes
- 6330 Lincoln Ave Unit 2E
- 6330 Lincoln Ave Unit 2A
- 8400 Callie Ave Unit D209
- 8400 Callie Ave Unit D207
- 6411 Elm St
- 8425 Callie Ave Unit 62
- 8380 Miami Ave
- 6140 Elm St
- 8300 Callie Ave Unit F314
- 8300 Callie Ave Unit F610
- 8712 Ferris Ave
- 6166 Mayfair St Unit 33714
- 6163 Mayfair St Unit 102714
- 6330 Hennings Ct
- 6338 Hennings Ct
- 6336 Hennings Ct
- 6340 Hennings Ct
- 6332 Hennings Ct
- 6342 Hennings Ct
- 6344 Hennings Ct
- 8525 Ferris Ave Unit 6
- 8525 Ferris Ave
- 8521 Ferris Ave Unit 8
- 8527 Ferris Ave Unit 5
- 8531 Ferris Ave Unit 3
- 8529 Ferris Ave Unit 4
- 8533 Ferris Ave Unit 2
- 8535 Ferris Ave Unit 1
- 6323 Lincoln Ave Unit 122
- 6321 Lincoln Ave Unit 123
- 6321 Lincoln Ave Unit 1C
- 6325 Lincoln Ave Unit 121
- 6319 Lincoln Ave Unit 124
- 6317 Lincoln Ave Unit 125
- 8530 Callie Ave
- 8534 Callie Ave
- 6300 Lincoln Ave
- 6311 Lincoln Ave Unit 132
- 6311 Lincoln Ave Unit 131
- 6311 Lincoln Ave