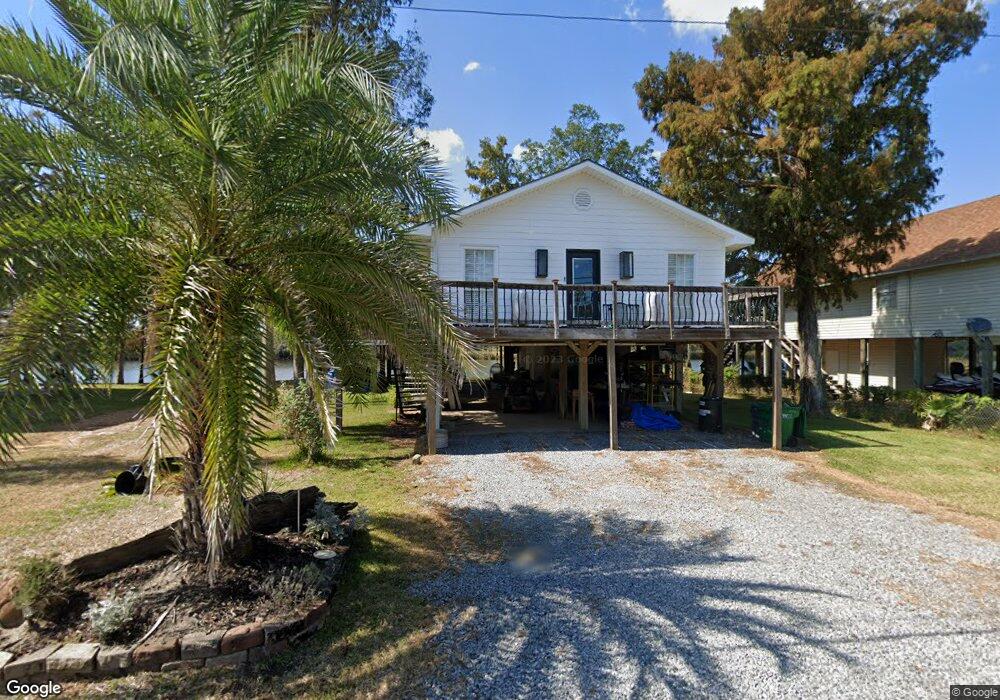
8524 Cochran Ave Moss Point, MS 39562
Estimated Value: $163,297 - $249,000
Studio
1
Bath
2,001
Sq Ft
$100/Sq Ft
Est. Value
About This Home
This home is located at 8524 Cochran Ave, Moss Point, MS 39562 and is currently estimated at $199,324, approximately $99 per square foot. 8524 Cochran Ave is a home located in Jackson County with nearby schools including Kreole Primary Elementary School, Escatawpa Upper Elementary School, and Magnolia Middle School.
Create a Home Valuation Report for This Property
The Home Valuation Report is an in-depth analysis detailing your home's value as well as a comparison with similar homes in the area
Home Values in the Area
Average Home Value in this Area
Tax History
| Year | Tax Paid | Tax Assessment Tax Assessment Total Assessment is a certain percentage of the fair market value that is determined by local assessors to be the total taxable value of land and additions on the property. | Land | Improvement |
|---|---|---|---|---|
| 2025 | $1,271 | $13,020 | $1,131 | $11,889 |
| 2024 | $1,271 | $12,645 | $1,102 | $11,543 |
| 2023 | $1,225 | $12,645 | $1,102 | $11,543 |
| 2022 | $1,227 | $12,645 | $1,102 | $11,543 |
| 2021 | $1,237 | $12,720 | $1,102 | $11,618 |
| 2020 | $1,072 | $11,230 | $863 | $10,367 |
| 2019 | $1,045 | $11,230 | $863 | $10,367 |
| 2018 | $1,030 | $11,107 | $863 | $10,244 |
| 2017 | $788 | $9,131 | $863 | $8,268 |
| 2016 | $407 | $9,131 | $863 | $8,268 |
| 2015 | $342 | $80,710 | $8,630 | $72,080 |
| 2014 | $373 | $8,314 | $863 | $7,451 |
| 2013 | $375 | $8,343 | $863 | $7,480 |
Source: Public Records
Map
Nearby Homes
- 8304 Austeria St
- 3700 Cochran Ave
- 9277 Riverlodge Dr
- 8629 Mississippi 613
- 3401 Goldenrod Ave
- 4316 Knowlcrest Dr
- 4113 Mimosa Dr
- 9504 Kimberly Cir
- No Wilkerson Cir
- 0 Hwy 613 Hwy Unit 4127039
- 0 Hwy 613 Hwy Unit 4137821
- 0 Hwy 613 Hwy Unit 4129036
- 9621 Donchester Cir
- 0 Downing Ave
- 3712 Dale Ln
- 7621 Elder Ferry Rd
- 6924 Barnes Rd
- 6908 Barnes Rd
- 0 Mississippi 613
- 0 N Hwy 613 Unit 4144527
- 8515 Cochran Ave
- 8418 Cochran Ave
- 8525 Cochran Ave
- 8412 Cochran Ave
- 8528 Cochran Ave
- 8408 Cochran Ave
- 8600 Cochran Ave
- 8604 Cochran Ave
- 8608 Cochran Ave
- 8344 Cochran Ave
- 8612 Cochran Ave
- 8317 Cochran Ave
- 8328 Cochran Ave
- 8704 Cochran Ave
- 8320 Cochran Ave
- 3102 Cochran Ave
- 8319 Cochran Ave
- 8319 Cochran Ave E
- 8318 Cochran Ave
- 3104 Cochran Ave
Your Personal Tour Guide
Ask me questions while you tour the home.