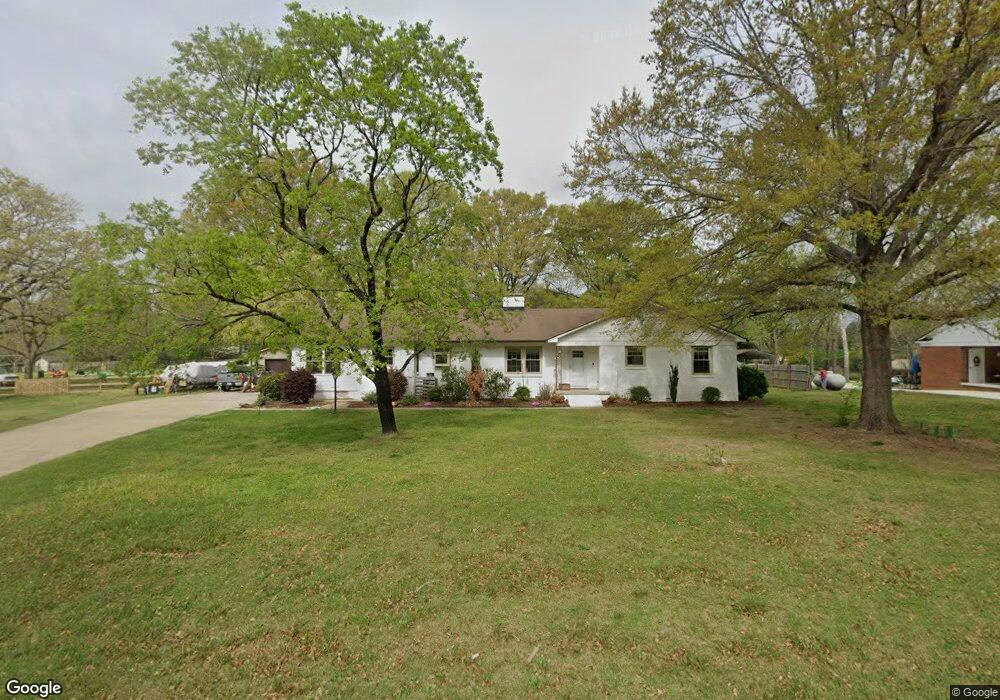
8524 Manns Loop Rd Apex, NC 27539
Middle Creek NeighborhoodEstimated Value: $412,000 - $457,000
3
Beds
2
Baths
2,147
Sq Ft
$204/Sq Ft
Est. Value
About This Home
This home is located at 8524 Manns Loop Rd, Apex, NC 27539 and is currently estimated at $437,621, approximately $203 per square foot. 8524 Manns Loop Rd is a home located in Wake County with nearby schools including West Lake Elementary School, West Lake Middle, and Middle Creek High.
Ownership History
Date
Name
Owned For
Owner Type
Purchase Details
Closed on
Jun 11, 2014
Sold by
Burch Diane Lynn
Bought by
Fitzgerald Daniel and Fitzgerald Rebecca
Current Estimated Value
Home Financials for this Owner
Home Financials are based on the most recent Mortgage that was taken out on this home.
Original Mortgage
$203,979
Interest Rate
4.2%
Mortgage Type
New Conventional
Purchase Details
Closed on
Nov 27, 2013
Sold by
Burch Thomas Edward
Bought by
Burch Diane Lynn
Purchase Details
Closed on
Oct 6, 2000
Sold by
Nye James Franklin and Nye Dorothy Klick
Bought by
Burch Thomas E and Burch Diane L
Home Financials for this Owner
Home Financials are based on the most recent Mortgage that was taken out on this home.
Original Mortgage
$64,900
Interest Rate
7.69%
Create a Home Valuation Report for This Property
The Home Valuation Report is an in-depth analysis detailing your home's value as well as a comparison with similar homes in the area
Home Values in the Area
Average Home Value in this Area
Purchase History
| Date | Buyer | Sale Price | Title Company |
|---|---|---|---|
| Fitzgerald Daniel | $200,000 | None Available | |
| Burch Diane Lynn | -- | None Available | |
| Burch Thomas E | $165,500 | -- |
Source: Public Records
Mortgage History
| Date | Status | Borrower | Loan Amount |
|---|---|---|---|
| Previous Owner | Fitzgerald Daniel | $203,979 | |
| Previous Owner | Burch Thomas E | $64,900 |
Source: Public Records
Tax History
| Year | Tax Paid | Tax Assessment Tax Assessment Total Assessment is a certain percentage of the fair market value that is determined by local assessors to be the total taxable value of land and additions on the property. | Land | Improvement |
|---|---|---|---|---|
| 2025 | $2,404 | $372,791 | $130,000 | $242,791 |
| 2024 | $2,315 | $369,491 | $130,000 | $239,491 |
Source: Public Records
Map
Nearby Homes
- 8224 Bells Lake Rd
- 8220 Bells Lake Rd
- 4004 Old Sturbridge Dr
- 8801 Valley Hill Ct
- 4412 Fairview Ridge Ln
- 8313 Covington Hill Way
- 273 Meadow Beauty Dr
- 5045 Homeplace Dr
- 4913 Mashpee Ln
- 5004 Rustler Ct
- 4912 Overeasy Dr
- 5012 Rustler Ct
- 5008 Rustler Ct
- 5153 Dove Forest Ln
- 4908 Dr
- 5024 Overeasy Dr
- 7243 Capulin Crest Dr
- 212 Sea Biscuit Ln Unit 25
- 0 Rhodes Rd Unit 10147590
- 5032 Overeasy Dr
- 8520 Manns Loop Rd
- 4609 Meadow Lake Dr
- 8532 Manns Loop Rd
- 4621 Meadow Lake Dr
- 8525 Manns Loop Rd
- 8512 Manns Loop Rd
- 4625 Meadow Lake Dr
- 8521 Manns Loop Rd
- 8537 Manns Loop Rd
- 4604 Meadow Lake Dr
- 8508 Manns Loop Rd
- 8600 Manns Loop Rd
- 4612 Meadow Lake Dr
- 4616 Meadow Lake Dr
- 4701 Meadow Lake Dr
- 4416 Twig Ct
- 8509 Manns Loop Rd
- 8601 Manns Loop Rd
- 3300 Shannon Cir
- 4413 Twig Ct
Your Personal Tour Guide
Ask me questions while you tour the home.