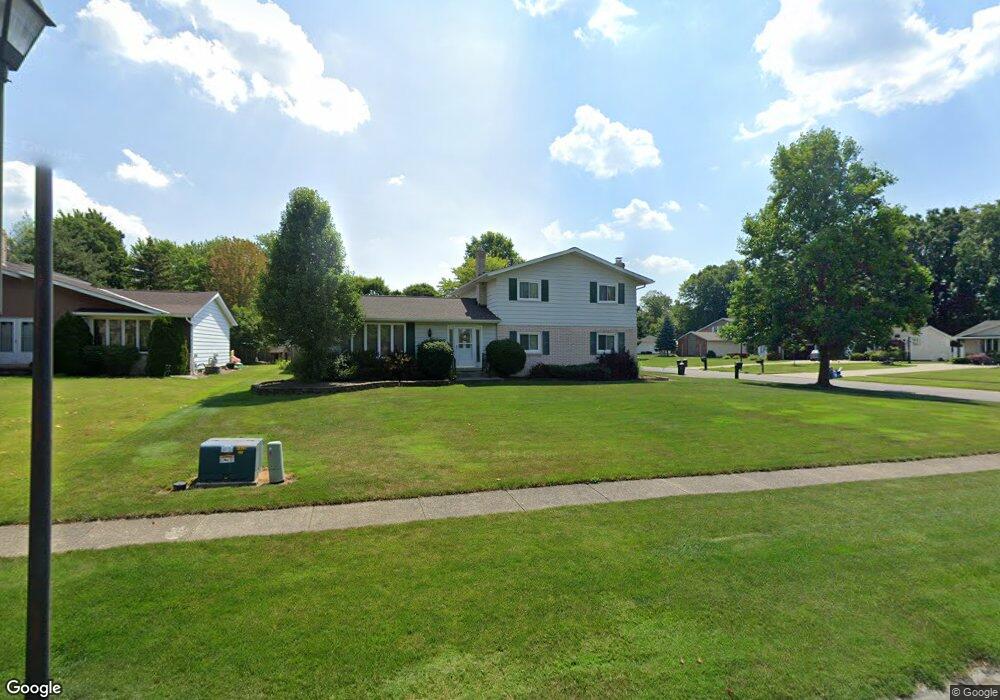
8525 Litto Dr Strongsville, OH 44136
Estimated Value: $352,898 - $417,000
3
Beds
3
Baths
2,868
Sq Ft
$134/Sq Ft
Est. Value
About This Home
This home is located at 8525 Litto Dr, Strongsville, OH 44136 and is currently estimated at $384,725, approximately $134 per square foot. 8525 Litto Dr is a home located in Cuyahoga County with nearby schools including Strongsville High School, The Academy of St. Bartholomew, and Bethel Christian Academy.
Ownership History
Date
Name
Owned For
Owner Type
Purchase Details
Closed on
Mar 21, 2007
Sold by
Adkins Sharon Ann
Bought by
Koshel John J and Koshel Amy
Current Estimated Value
Home Financials for this Owner
Home Financials are based on the most recent Mortgage that was taken out on this home.
Original Mortgage
$159,920
Outstanding Balance
$96,850
Interest Rate
6.27%
Mortgage Type
Purchase Money Mortgage
Estimated Equity
$287,875
Purchase Details
Closed on
Aug 5, 1991
Sold by
Pribula Daniel
Bought by
Adkins Sharon Ann
Purchase Details
Closed on
Mar 13, 1987
Sold by
Hibshman Lawrence K
Bought by
Pribula Daniel
Purchase Details
Closed on
Jul 13, 1983
Sold by
Nepple La Verne D
Bought by
Hibshman Lawrence K
Purchase Details
Closed on
Aug 10, 1977
Sold by
Brown Richard M and Brown Jolyn T
Bought by
Nepple La Verne D
Purchase Details
Closed on
Nov 12, 1975
Bought by
Brown Richard M and Brown Jolyn T
Purchase Details
Closed on
Jan 1, 1975
Bought by
Oakland Pk Est Inc
Create a Home Valuation Report for This Property
The Home Valuation Report is an in-depth analysis detailing your home's value as well as a comparison with similar homes in the area
Home Values in the Area
Average Home Value in this Area
Purchase History
| Date | Buyer | Sale Price | Title Company |
|---|---|---|---|
| Koshel John J | $199,900 | Executive Title Agency Corp | |
| Adkins Sharon Ann | $127,000 | -- | |
| Pribula Daniel | $109,000 | -- | |
| Hibshman Lawrence K | $93,000 | -- | |
| Nepple La Verne D | $73,000 | -- | |
| Brown Richard M | $59,500 | -- | |
| Oakland Pk Est Inc | -- | -- |
Source: Public Records
Mortgage History
| Date | Status | Borrower | Loan Amount |
|---|---|---|---|
| Open | Koshel John J | $159,920 |
Source: Public Records
Tax History Compared to Growth
Tax History
| Year | Tax Paid | Tax Assessment Tax Assessment Total Assessment is a certain percentage of the fair market value that is determined by local assessors to be the total taxable value of land and additions on the property. | Land | Improvement |
|---|---|---|---|---|
| 2024 | $4,672 | $99,505 | $19,810 | $79,695 |
| 2023 | $5,010 | $80,020 | $21,040 | $58,980 |
| 2022 | $4,974 | $80,010 | $21,035 | $58,975 |
| 2021 | $4,935 | $80,010 | $21,040 | $58,980 |
| 2020 | $4,687 | $67,240 | $17,680 | $49,560 |
| 2019 | $4,550 | $192,100 | $50,500 | $141,600 |
| 2018 | $4,129 | $67,240 | $17,680 | $49,560 |
| 2017 | $4,142 | $62,440 | $17,150 | $45,290 |
| 2016 | $4,109 | $62,440 | $17,150 | $45,290 |
| 2015 | $4,010 | $62,440 | $17,150 | $45,290 |
| 2014 | $4,010 | $60,100 | $16,660 | $43,440 |
Source: Public Records
Map
Nearby Homes
- 13976 W Sprague Rd
- 14015 Byron Blvd
- 9531 Nicole Cir
- 7685 Saratoga Rd
- 9129 Tahoe Cir
- Buchanan Plan at The Enclave at Pine Lakes Crossing
- Belleville Plan at The Enclave at Pine Lakes Crossing
- 8761 Windfall Ct
- 9890 Webster Rd
- 7664 Gerald Dr
- 10010 Chevy Chase
- 12972 W Sprague Rd
- 13541 Indian Creek Dr
- 14280 Pawnee Trail
- 14330 Pawnee Trail
- 12631 Pinebrook Dr
- 14069 Basswood Cir
- 12721 Patricia Dr
- 0 Webster Rd
- 9945 Twelve Oaks Cir
- 8491 Litto Dr
- 14456 Oakland Park Dr
- 8455 Litto Dr
- 14424 Oakland Park Dr
- 14487 Oakland Park Dr
- 14465 Oakland Park Dr
- 8526 Litto Dr
- 14515 Oakland Park Dr
- 8490 Litto Dr
- 14429 Oakland Park Dr
- 14593 Oakland Park Dr
- 8445 Litto Dr
- 8445 Litto Dr
- 14412 Oakland Park Dr
- 14415 Oakland Park Dr
- 14605 Oakland Park Dr
- 8454 Litto Dr
- 8361 Litto Dr
- 14400 Oakland Park Dr
- 14317 Wilma Dr