8525 Oakwood Ct Jackson, MI 49201
Estimated Value: $242,000 - $349,000
3
Beds
1
Bath
1,025
Sq Ft
$275/Sq Ft
Est. Value
About This Home
This home is located at 8525 Oakwood Ct, Jackson, MI 49201 and is currently estimated at $281,458, approximately $274 per square foot. 8525 Oakwood Ct is a home located in Jackson County with nearby schools including Ezra Eby Elementary School, Napoleon Middle School, and Napoleon High School.
Ownership History
Date
Name
Owned For
Owner Type
Purchase Details
Closed on
Jul 2, 2014
Sold by
Mcparlane Melissa and Carron Robert
Bought by
Mcparlane Melissa
Current Estimated Value
Purchase Details
Closed on
Oct 9, 2011
Sold by
Jackson David and Jackson Carol
Bought by
Jackson Carol and The Carol Jackson Revocable Trust
Purchase Details
Closed on
Sep 9, 2009
Sold by
Cox Robert L and Cox Denise K
Bought by
Jackson David L and Jackson Carol
Home Financials for this Owner
Home Financials are based on the most recent Mortgage that was taken out on this home.
Original Mortgage
$103,903
Outstanding Balance
$68,228
Interest Rate
5.27%
Mortgage Type
New Conventional
Estimated Equity
$213,230
Purchase Details
Closed on
Aug 20, 2004
Sold by
Urbaniak Avice A and Urbaniak Thomas L
Bought by
Cox Robert L and Cox Denise K
Purchase Details
Closed on
Jul 1, 1993
Bought by
Urbaniak
Create a Home Valuation Report for This Property
The Home Valuation Report is an in-depth analysis detailing your home's value as well as a comparison with similar homes in the area
Home Values in the Area
Average Home Value in this Area
Purchase History
| Date | Buyer | Sale Price | Title Company |
|---|---|---|---|
| Mcparlane Melissa | -- | None Available | |
| Jackson Carol | -- | None Available | |
| Jackson David L | $129,879 | At | |
| Cox Robert L | $100,000 | At | |
| Urbaniak | $67,900 | -- |
Source: Public Records
Mortgage History
| Date | Status | Borrower | Loan Amount |
|---|---|---|---|
| Open | Jackson David L | $103,903 |
Source: Public Records
Tax History Compared to Growth
Tax History
| Year | Tax Paid | Tax Assessment Tax Assessment Total Assessment is a certain percentage of the fair market value that is determined by local assessors to be the total taxable value of land and additions on the property. | Land | Improvement |
|---|---|---|---|---|
| 2025 | $3,471 | $85,200 | $0 | $85,200 |
| 2024 | $2,568 | $90,700 | $0 | $0 |
| 2023 | $2,446 | $88,300 | $0 | $0 |
| 2022 | $3,057 | $79,200 | $0 | $0 |
| 2021 | $2,995 | $77,400 | $0 | $0 |
| 2020 | $2,978 | $67,900 | $0 | $0 |
| 2019 | $2,941 | $59,700 | $0 | $0 |
| 2018 | $3,169 | $56,381 | $0 | $0 |
| 2017 | $3,119 | $56,800 | $0 | $0 |
| 2016 | $2,124 | $60,254 | $2,720 | $57,534 |
| 2015 | $3,063 | $60,726 | $0 | $60,726 |
| 2014 | $3,063 | $52,481 | $0 | $52,481 |
| 2013 | -- | $52,481 | $0 | $52,481 |
Source: Public Records
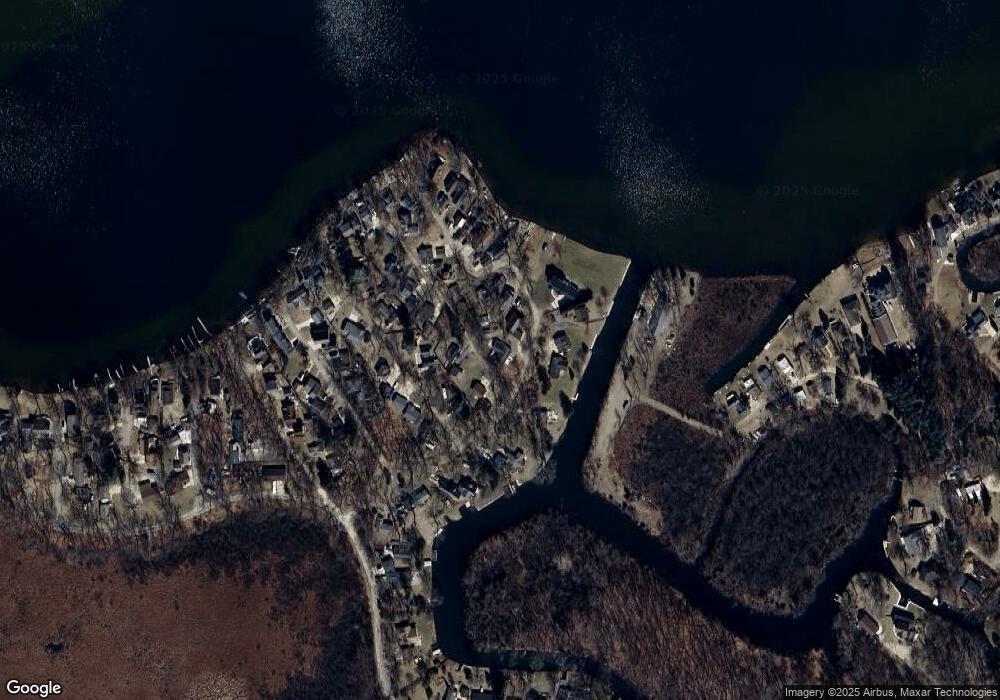
Map
Nearby Homes
- 8000 S Portage Rd
- 3588 Nash Dr
- 00 Eastwood Beach Dr
- 8020 Greenes Dr
- 7150 Greenes Dr
- 5791 Oakpoint Rd
- VL MacK Island Rd
- 5820 Squires Rd
- 6533 Bluebird Ct
- 17 Coronado Dr
- 35 Coronado Dr Unit 35
- 9260 Charmin Place
- 10300 Rexford Rd
- 34 Skylark Dr
- 45 Coronado Dr
- 208 Plymouth St
- 30 Coronado Dr
- 44 Coronado Dr Unit 37
- 6287 Brooklyn Rd
- 47 Coronado Dr
- 8517 Mott Dr
- 8511 Mott Dr
- 2308 Collingwood
- 8476 Mott Dr
- 8522 Oakwood Ct
- 8526 Oakwood Ct
- 8523 Collingwood Ct
- 8485 Mott Dr
- 8544 Oakwood Ct
- 8521 Collingwood Ct
- 8524 Glenwood Ct
- 8541 Oakwood Ct
- 8483 Mott Dr
- 8594 Glenwood Ct
- 8500 Mott Dr
- 8465 Mott Dr
- 8505 Mott Dr
- 8549 Collingwood Ct
- 8548 Oakwood Ct
- 8545 Collingwood Ct