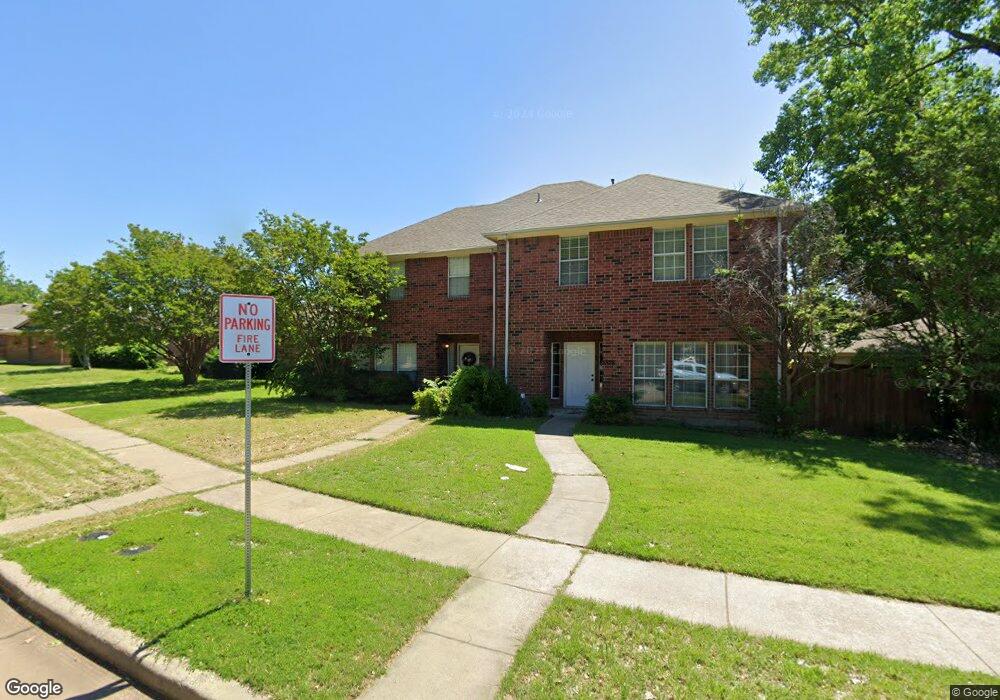
8528 Holly St Unit 8530 Frisco, TX 75034
Rail District NeighborhoodEstimated Value: $358,000 - $588,000
3
Beds
3
Baths
1,333
Sq Ft
$377/Sq Ft
Est. Value
About This Home
This home is located at 8528 Holly St Unit 8530, Frisco, TX 75034 and is currently estimated at $502,898, approximately $377 per square foot. 8528 Holly St Unit 8530 is a home located in Collin County with nearby schools including Bright Academy, Staley Middle, and Frisco High School.
Ownership History
Date
Name
Owned For
Owner Type
Purchase Details
Closed on
Nov 9, 2009
Sold by
Ates D Wesley D and Ates Drusilla D
Bought by
Chen Yunmei
Current Estimated Value
Home Financials for this Owner
Home Financials are based on the most recent Mortgage that was taken out on this home.
Original Mortgage
$157,500
Outstanding Balance
$101,944
Interest Rate
4.83%
Mortgage Type
New Conventional
Estimated Equity
$400,954
Purchase Details
Closed on
Sep 13, 1999
Sold by
Chrisman Richard and Chrisman Indira Ruth
Bought by
Ates D Wesley D and Ates Drusilla D
Home Financials for this Owner
Home Financials are based on the most recent Mortgage that was taken out on this home.
Original Mortgage
$170,400
Interest Rate
7.86%
Purchase Details
Closed on
Mar 2, 1998
Sold by
Orsi Land Investment Inc
Bought by
Chrisman Richard and Chrisman Indira Ruth
Create a Home Valuation Report for This Property
The Home Valuation Report is an in-depth analysis detailing your home's value as well as a comparison with similar homes in the area
Home Values in the Area
Average Home Value in this Area
Purchase History
| Date | Buyer | Sale Price | Title Company |
|---|---|---|---|
| Chen Yunmei | -- | Fnt | |
| Ates D Wesley D | -- | -- | |
| Chrisman Richard | -- | -- |
Source: Public Records
Mortgage History
| Date | Status | Borrower | Loan Amount |
|---|---|---|---|
| Open | Chen Yunmei | $157,500 | |
| Previous Owner | Ates D Wesley D | $170,400 |
Source: Public Records
Tax History Compared to Growth
Tax History
| Year | Tax Paid | Tax Assessment Tax Assessment Total Assessment is a certain percentage of the fair market value that is determined by local assessors to be the total taxable value of land and additions on the property. | Land | Improvement |
|---|---|---|---|---|
| 2025 | $10,479 | $709,892 | $198,000 | $511,892 |
| 2024 | $10,479 | $623,258 | $154,000 | $469,258 |
| 2023 | $10,479 | $624,000 | $154,000 | $470,000 |
| 2022 | $9,991 | $527,736 | $121,000 | $406,736 |
| 2021 | $8,824 | $449,500 | $121,000 | $328,500 |
| 2020 | $7,374 | $361,284 | $88,000 | $273,284 |
| 2019 | $6,892 | $320,788 | $88,000 | $232,788 |
| 2018 | $7,755 | $355,956 | $55,000 | $300,956 |
| 2017 | $7,340 | $336,884 | $50,000 | $286,884 |
| 2016 | $4,777 | $217,165 | $50,000 | $167,165 |
| 2015 | $4,618 | $223,679 | $44,000 | $179,679 |
Source: Public Records
Map
Nearby Homes
- 8701 Woodstream Dr
- 8400 Hickory St Unit 4004
- 8400 Hickory St Unit 2902
- 8400 Hickory St Unit 2101
- 8400 Hickory St Unit 103
- 8400 Hickory St Unit 2301
- 8351 Rock Brook St
- 8801 Holly St
- 8074 Dove Cove
- 7704 Parkbrook Dr
- 8100 Hillside Dr
- 7817 Rimrock Cir
- 8783 Carroll Cir
- 8600 S County Rd
- 8761 S County Rd
- 8605 Moraine Dr
- 7274 Pecan St
- 7204 Fieldstone Dr
- 7243 Ash St
- 7242 Pecan St