8529 E Valley Rd Dunlap, TN 37327
Estimated Value: $296,000 - $614,000
About This Home
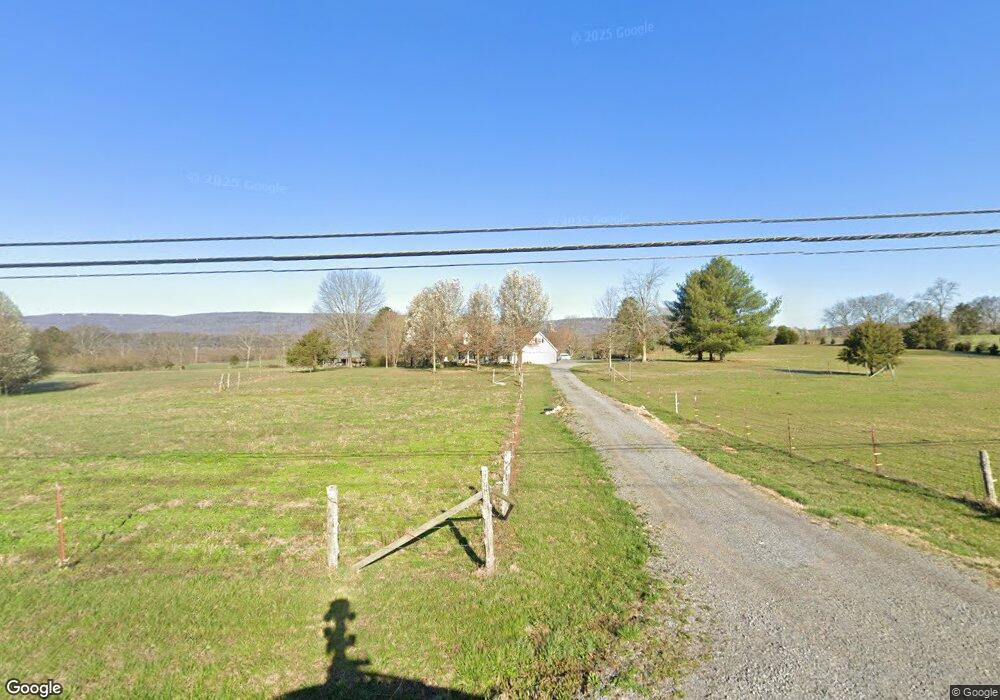
This home is located at 8529 E Valley Rd, Dunlap, TN 37327 and is currently estimated at $479,196, approximately $312 per square foot. 8529 E Valley Rd is a home located in Sequatchie County with nearby schools including Griffith Elementary School, Sequatchie County Middle School, and Sequatchie County High School.
Ownership History
We collect this data history from publicly available records. To have your information removed, we recommend requesting removal directly through your county’s website.
Purchase Details
Purchase Details
Purchase Details
Purchase Details
Purchase Details
Purchase Details
Purchase Details
Purchase Details
Purchase Details
Purchase Details
Purchase Details
Purchase Details
Purchase Details
Home Financials for this Owner
Home Financials are based on the most recent Mortgage that was taken out on this home.Purchase Details
Home Financials for this Owner
Home Financials are based on the most recent Mortgage that was taken out on this home.Purchase Details
Home Financials for this Owner
Home Financials are based on the most recent Mortgage that was taken out on this home.Purchase Details
Purchase Details
Purchase Details
Purchase Details
Purchase Details
Purchase Details
Purchase Details
Purchase Details
Purchase Details
Purchase Details
Home Values in the Area
Average Home Value in this Area
Purchase History
We collect this data history from publicly available records. To have your information removed, we recommend requesting removal directly through your county’s website.
| Date | Buyer | Sale Price | Title Company |
|---|---|---|---|
| $60,000 | -- | ||
| $1,800 | -- | ||
| $82,000 | -- | ||
| $7,995 | -- | ||
| -- | -- | ||
| $18,000 | -- | ||
| $14,000 | -- | ||
| $12,000 | -- | ||
| $9,000 | -- | ||
| -- | -- | ||
| -- | -- | ||
| $50,000 | -- | ||
| $55,000 | -- | ||
| $7,400 | -- | ||
| $13,000 | -- | ||
| $160,000 | -- | ||
| $12,000 | -- | ||
| $54,000 | -- | ||
| $9,000 | -- | ||
| $1,200 | -- | ||
| $8,000 | -- | ||
| $10,000 | -- | ||
| $94,000 | -- | ||
| $60,000 | -- | ||
| $8,500 | -- | ||
| $40,000 | -- |
Mortgage History
We collect this data history from publicly available records. To have your information removed, we recommend requesting removal directly through your county’s website.
| Date | Status | Borrower | Loan Amount |
|---|---|---|---|
| Previous Owner | $150,000 |
Tax History
We collect this data history from publicly available records. To have your information removed, we recommend requesting removal directly through your county’s website.
| Year | Tax Paid | Tax Assessment Tax Assessment Total Assessment is a certain percentage of the fair market value that is determined by local assessors to be the total taxable value of land and additions on the property. | Land | Improvement |
|---|---|---|---|---|
| 2025 | $1,375 | $74,850 | $13,100 | $61,750 |
| 2024 | $1,375 | $74,850 | $13,100 | $61,750 |
| 2023 | $1,375 | $74,850 | $13,100 | $61,750 |
| 2022 | $1,258 | $51,500 | $9,850 | $41,650 |
| 2021 | $1,258 | $51,500 | $9,850 | $41,650 |
| 2020 | $1,258 | $51,500 | $9,850 | $41,650 |
| 2019 | $1,258 | $51,500 | $9,850 | $41,650 |
| 2018 | $1,258 | $51,500 | $9,850 | $41,650 |
| 2017 | $1,258 | $51,500 | $9,850 | $41,650 |
| 2016 | $1,265 | $49,250 | $10,075 | $39,175 |
| 2015 | $1,265 | $49,250 | $10,075 | $39,175 |
| 2014 | $1,265 | $49,250 | $10,075 | $39,175 |
Map
- 7799 E Valley Rd
- 533 Gun Shop Rd
- 11869 E Valley Rd
- Lot 35 River Ridge Dr
- 530 Hill Dr
- 870 Ridge Rd
- 114 Carpenter Rd
- 177 Dogwood Ln
- 0 F Graham Rd Unit 1531039
- 65 Dogwood Ln
- 85 Bruce Green Rd
- Lot 13 B Greenfields Way
- 2089 Hudlow Loop Rd
- 68 Stagg St
- 1529 Main St
- Lot 36 River Ridge Dr
- 95 A Main St
- 21552 U S 127
- 0 SE US Hwy 127 Unit 1519993
- 0 SE US Hwy 127 Unit 1519990
- 14 Old York Hwy E
- 34 Old York Hwy E
- 5 E Valley Rd
- 3 E Valley Rd
- 1 E Valley Rd
- 3 E Valley Rd Unit LOT3
- 1658 E Valley Rd
- 244 E Valley Rd
- 244 E Valley Rd Unit D
- 244 E Valley Rd Unit F
- 8661 E Valley Rd
- 32 Old York Hwy E
- 32 Old York Hwy E Unit 32
- 32 Old York Hwy E
- 20 Old York Hwy E
- 27 Old York Hwy E
- 18 Lewis Rd
- 18 Lewis Rd
- 18 Lewis Rd
- 8299 E Valley Rd
Ask me questions while you tour the home.