853 Beech Ave Findlay, OH 45840
Estimated Value: $230,608 - $281,000
3
Beds
1
Bath
1,911
Sq Ft
$130/Sq Ft
Est. Value
About This Home
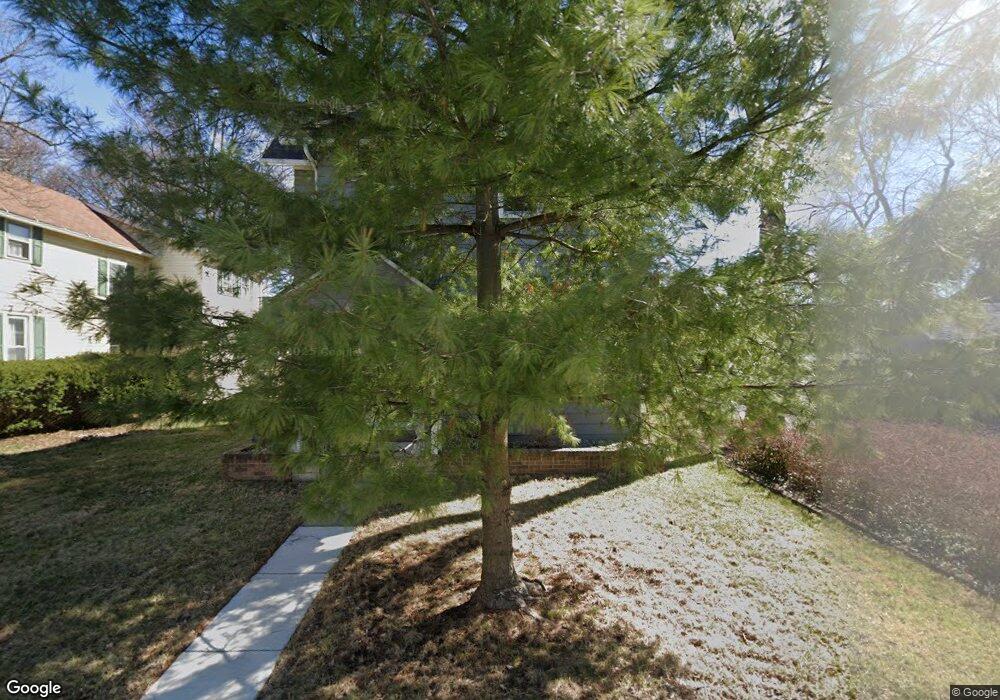
This home is located at 853 Beech Ave, Findlay, OH 45840 and is currently estimated at $247,652, approximately $129 per square foot. 853 Beech Ave is a home located in Hancock County with nearby schools including Lincoln Elementary School, Donnell Middle School, and Findlay High School.
Ownership History
Date
Name
Owned For
Owner Type
Purchase Details
Closed on
Mar 16, 2011
Sold by
Loach Stephen M and Loach Holly A
Bought by
Snyder Donald E
Current Estimated Value
Home Financials for this Owner
Home Financials are based on the most recent Mortgage that was taken out on this home.
Original Mortgage
$92,250
Outstanding Balance
$64,273
Interest Rate
5.09%
Mortgage Type
Purchase Money Mortgage
Estimated Equity
$183,379
Purchase Details
Closed on
Jul 10, 2008
Sold by
Anderson Freda B
Bought by
Loach Holly A and Loach Stephen M
Home Financials for this Owner
Home Financials are based on the most recent Mortgage that was taken out on this home.
Original Mortgage
$46,400
Interest Rate
6.15%
Mortgage Type
New Conventional
Purchase Details
Closed on
Jun 26, 2006
Sold by
Estate Of Joseph O Anderson
Bought by
Anderson Freda B
Create a Home Valuation Report for This Property
The Home Valuation Report is an in-depth analysis detailing your home's value as well as a comparison with similar homes in the area
Home Values in the Area
Average Home Value in this Area
Purchase History
| Date | Buyer | Sale Price | Title Company |
|---|---|---|---|
| Snyder Donald E | $102,500 | Assured Title | |
| Loach Holly A | $58,000 | Mid Am Title | |
| Anderson Freda B | -- | None Available |
Source: Public Records
Mortgage History
| Date | Status | Borrower | Loan Amount |
|---|---|---|---|
| Open | Snyder Donald E | $92,250 | |
| Previous Owner | Loach Holly A | $46,400 |
Source: Public Records
Tax History
| Year | Tax Paid | Tax Assessment Tax Assessment Total Assessment is a certain percentage of the fair market value that is determined by local assessors to be the total taxable value of land and additions on the property. | Land | Improvement |
|---|---|---|---|---|
| 2024 | $2,371 | $66,740 | $5,300 | $61,440 |
| 2023 | $2,375 | $66,740 | $5,300 | $61,440 |
| 2022 | $2,366 | $66,740 | $5,300 | $61,440 |
| 2021 | $1,738 | $42,700 | $5,300 | $37,400 |
| 2020 | $1,738 | $42,700 | $5,300 | $37,400 |
| 2019 | $1,703 | $42,700 | $5,300 | $37,400 |
| 2018 | $1,500 | $34,460 | $4,240 | $30,220 |
| 2017 | $1,498 | $34,460 | $4,240 | $30,220 |
| 2016 | $1,501 | $34,880 | $4,240 | $30,640 |
| 2015 | $1,345 | $30,770 | $4,240 | $26,530 |
| 2014 | $1,346 | $30,770 | $4,240 | $26,530 |
| 2012 | $1,358 | $30,770 | $4,240 | $26,530 |
Source: Public Records
Map
Nearby Homes
- 829 Maple Ave
- 865 S Main St
- 216 1st St
- 815 Liberty St
- 123 Glendale Ave
- 412 Lima Ave
- 845 Hurd Ave
- 206 Greenlawn Ave
- 423 Elm St
- 860 Hurd Ave
- 1113 Hurd Ave
- 514 Liberty St
- 623 E Sandusky St
- 324 W Mcpherson Ave
- 527 W Sandusky St
- 731 5th St
- 407 Washington St
- 15591 Canadian Way
- 15586 Canadian Way
- 15615 Canadian Way
- 845 Beech Ave
- 843 Beech Ave
- 841 Beech Ave
- 852 Maple Ave
- 200 Hancock St
- 848 Maple Ave
- 210 Hancock St
- 839 Beech Ave
- 130 Hancock St
- 212 Hancock St
- 852 Beech Ave Unit R
- 850 Beech Ave
- 860 Maple Ave
- 840 Maple Ave
- 844 Beech Ave
- 838 Maple Ave
- 837 Beech Ave
- 842 Beech Ave
- 120 Hancock St Unit 22
- 216 Hancock St
Your Personal Tour Guide
Ask me questions while you tour the home.