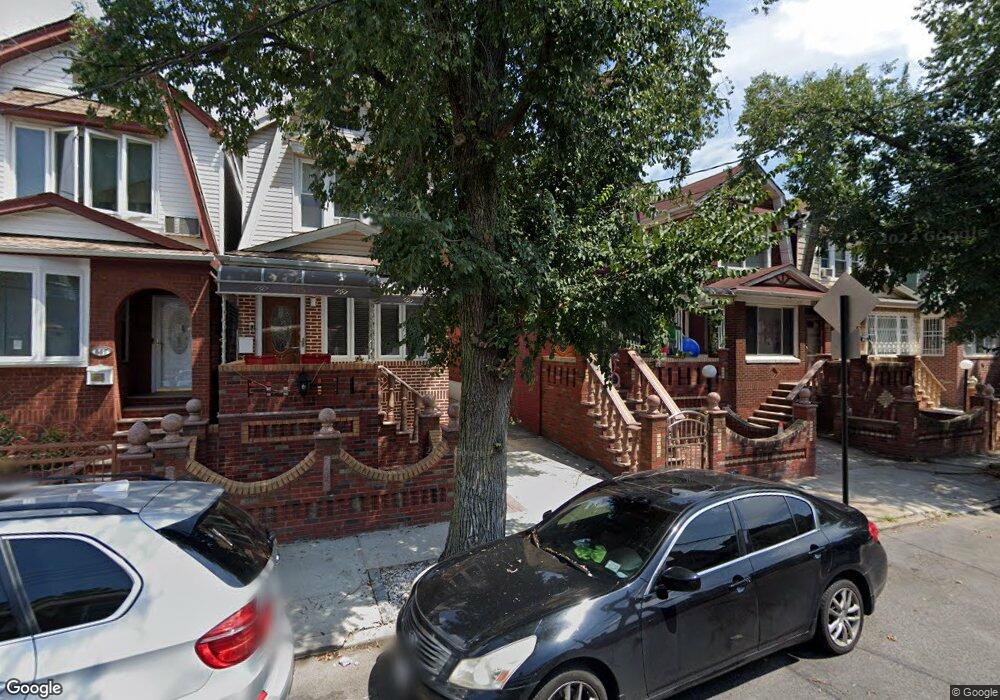
853 E 45th St Brooklyn, NY 11203
East Flatbush NeighborhoodEstimated Value: $680,639 - $754,000
Studio
--
Bath
1,498
Sq Ft
$485/Sq Ft
Est. Value
About This Home
This home is located at 853 E 45th St, Brooklyn, NY 11203 and is currently estimated at $726,160, approximately $484 per square foot. 853 E 45th St is a home located in Kings County with nearby schools including P.S. 208 Elsa Ebeling, I.S. 285 Meyer Levin, and Ivy Hill Preparatory Charter School.
Ownership History
Date
Name
Owned For
Owner Type
Purchase Details
Closed on
Jun 14, 2005
Sold by
Abdul-Zahir Latif and Ashley Melida
Bought by
Ashley Melida
Current Estimated Value
Purchase Details
Closed on
May 6, 2004
Sold by
Fisher Esq David W
Bought by
Abdul-Zahir Latif and Ashley Melida
Purchase Details
Closed on
Feb 2, 1998
Sold by
Brown Catherine
Bought by
Fils Beverly Tucker and Fils Frantz
Create a Home Valuation Report for This Property
The Home Valuation Report is an in-depth analysis detailing your home's value as well as a comparison with similar homes in the area
Home Values in the Area
Average Home Value in this Area
Purchase History
| Date | Buyer | Sale Price | Title Company |
|---|---|---|---|
| Ashley Melida | -- | -- | |
| Ashley Melida | -- | -- | |
| Abdul-Zahir Latif | -- | -- | |
| Abdul-Zahir Latif | -- | -- | |
| Fils Beverly Tucker | $157,500 | -- | |
| Fils Beverly Tucker | $157,500 | -- |
Source: Public Records
Mortgage History
| Date | Status | Borrower | Loan Amount |
|---|---|---|---|
| Closed | Abdul-Zahir Latif | $0 |
Source: Public Records
Tax History
| Year | Tax Paid | Tax Assessment Tax Assessment Total Assessment is a certain percentage of the fair market value that is determined by local assessors to be the total taxable value of land and additions on the property. | Land | Improvement |
|---|---|---|---|---|
| 2025 | $6,145 | $46,140 | $12,720 | $33,420 |
| 2024 | $6,145 | $42,900 | $12,720 | $30,180 |
| 2023 | $5,862 | $48,780 | $12,720 | $36,060 |
| 2022 | $5,762 | $45,420 | $12,720 | $32,700 |
| 2021 | $5,739 | $43,200 | $12,720 | $30,480 |
| 2020 | $2,827 | $39,240 | $12,720 | $26,520 |
| 2019 | $5,333 | $36,540 | $12,720 | $23,820 |
| 2018 | $4,903 | $24,052 | $9,675 | $14,377 |
| 2017 | $4,903 | $24,052 | $10,735 | $13,317 |
| 2016 | $4,543 | $22,725 | $10,565 | $12,160 |
| 2015 | $2,737 | $22,519 | $12,278 | $10,241 |
| 2014 | $2,737 | $21,246 | $12,576 | $8,670 |
Source: Public Records
Map
Nearby Homes
Your Personal Tour Guide
Ask me questions while you tour the home.