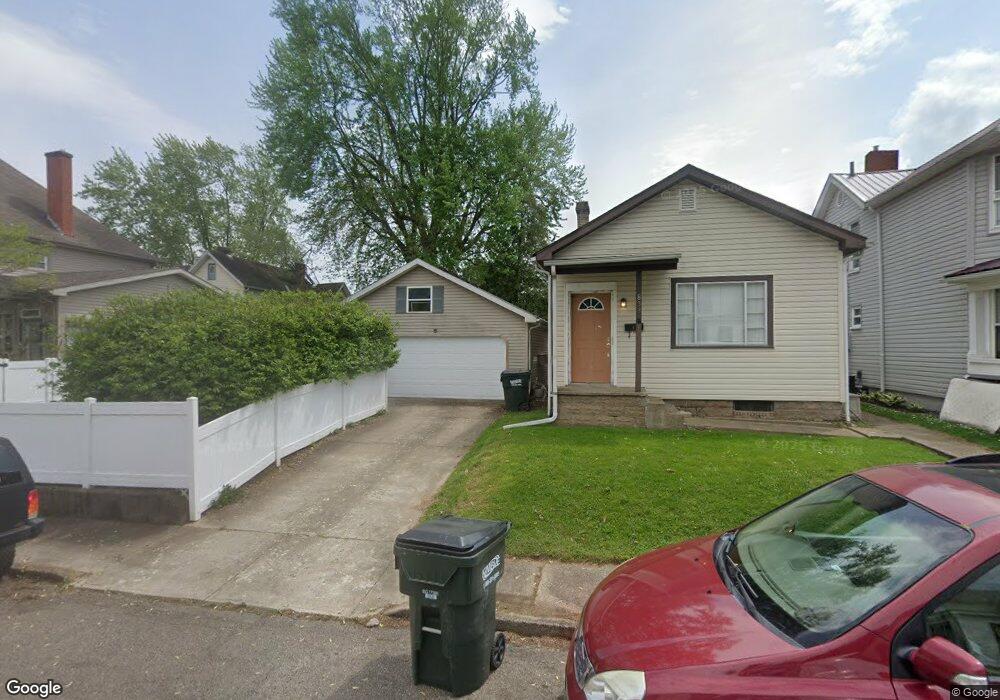
853 Locust St Coshocton, OH 43812
Estimated Value: $48,000 - $90,000
2
Beds
1
Bath
722
Sq Ft
$105/Sq Ft
Est. Value
About This Home
This home is located at 853 Locust St, Coshocton, OH 43812 and is currently estimated at $75,570, approximately $104 per square foot. 853 Locust St is a home located in Coshocton County with nearby schools including Coshocton High School, Coshocton Opportunity School, and Sacred Heart School.
Ownership History
Date
Name
Owned For
Owner Type
Purchase Details
Closed on
Aug 8, 2024
Sold by
Brown Rebecca and Miller Rebecca S
Bought by
Fick Eric M
Current Estimated Value
Home Financials for this Owner
Home Financials are based on the most recent Mortgage that was taken out on this home.
Original Mortgage
$35,000
Outstanding Balance
$34,090
Interest Rate
6.95%
Mortgage Type
New Conventional
Estimated Equity
$41,480
Purchase Details
Closed on
Oct 10, 1995
Sold by
Lipps James G
Bought by
Miller Rebecca S
Purchase Details
Closed on
Sep 1, 1987
Create a Home Valuation Report for This Property
The Home Valuation Report is an in-depth analysis detailing your home's value as well as a comparison with similar homes in the area
Home Values in the Area
Average Home Value in this Area
Purchase History
| Date | Buyer | Sale Price | Title Company |
|---|---|---|---|
| Fick Eric M | $43,750 | Fidelity National Title | |
| Miller Rebecca S | $34,000 | -- | |
| -- | $19,500 | -- |
Source: Public Records
Mortgage History
| Date | Status | Borrower | Loan Amount |
|---|---|---|---|
| Open | Fick Eric M | $35,000 |
Source: Public Records
Tax History Compared to Growth
Tax History
| Year | Tax Paid | Tax Assessment Tax Assessment Total Assessment is a certain percentage of the fair market value that is determined by local assessors to be the total taxable value of land and additions on the property. | Land | Improvement |
|---|---|---|---|---|
| 2024 | $657 | $15,500 | $1,800 | $13,700 |
| 2023 | $657 | $12,212 | $1,386 | $10,826 |
| 2022 | $630 | $12,212 | $1,386 | $10,826 |
| 2021 | $601 | $12,212 | $1,386 | $10,826 |
| 2020 | $566 | $11,134 | $1,351 | $9,783 |
| 2019 | $572 | $11,134 | $1,351 | $9,783 |
| 2018 | $567 | $11,134 | $1,351 | $9,783 |
| 2017 | $578 | $10,941 | $1,260 | $9,681 |
| 2016 | $556 | $10,941 | $1,260 | $9,681 |
| 2015 | $59 | $10,941 | $1,260 | $9,681 |
| 2014 | $102 | $10,623 | $1,680 | $8,943 |
Source: Public Records
Map
Nearby Homes