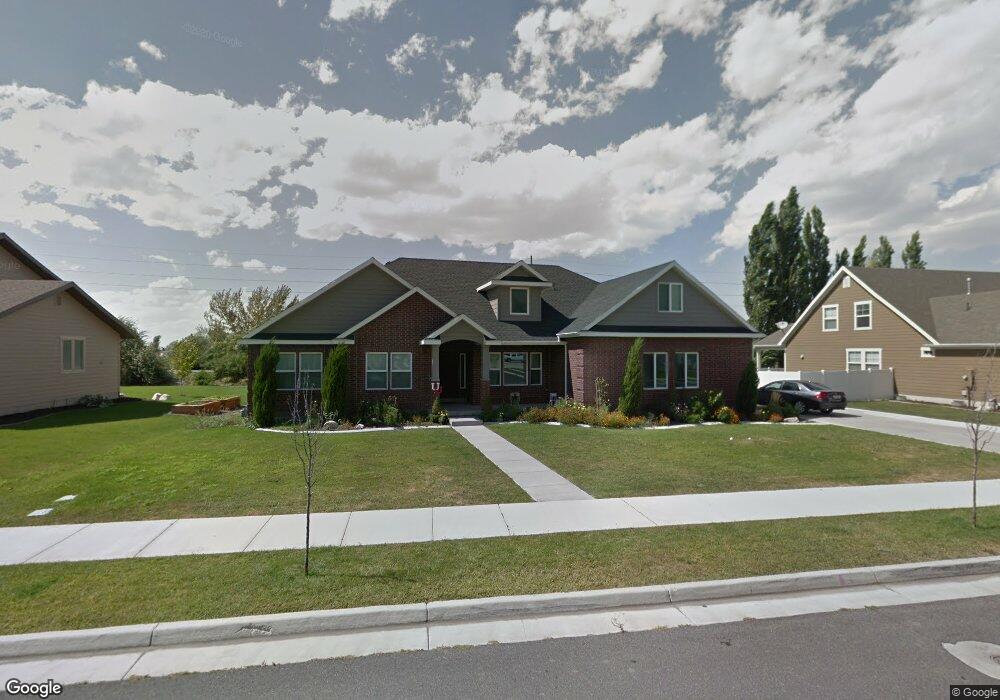
853 N 900 W West Bountiful, UT 84087
Estimated Value: $819,000 - $1,060,000
3
Beds
4
Baths
2,730
Sq Ft
$332/Sq Ft
Est. Value
About This Home
This home is located at 853 N 900 W, West Bountiful, UT 84087 and is currently estimated at $907,160, approximately $332 per square foot. 853 N 900 W is a home located in Davis County with nearby schools including West Bountiful Elementary School, Bountiful Junior High School, and Viewmont High School.
Ownership History
Date
Name
Owned For
Owner Type
Purchase Details
Closed on
May 13, 2011
Sold by
Henderson T J and Henderson Chantel
Bought by
Henderson Troy J and Henderson Chantel
Current Estimated Value
Home Financials for this Owner
Home Financials are based on the most recent Mortgage that was taken out on this home.
Original Mortgage
$297,000
Outstanding Balance
$205,286
Interest Rate
4.84%
Mortgage Type
New Conventional
Estimated Equity
$701,874
Purchase Details
Closed on
Oct 13, 2010
Sold by
Abj Development Inc
Bought by
Henderson T J and Henderson Chantel
Home Financials for this Owner
Home Financials are based on the most recent Mortgage that was taken out on this home.
Original Mortgage
$57,000
Interest Rate
4.26%
Mortgage Type
Seller Take Back
Create a Home Valuation Report for This Property
The Home Valuation Report is an in-depth analysis detailing your home's value as well as a comparison with similar homes in the area
Home Values in the Area
Average Home Value in this Area
Purchase History
| Date | Buyer | Sale Price | Title Company |
|---|---|---|---|
| Henderson Troy J | -- | Aspen Title Insuranc | |
| Henderson T J | -- | Aspen Title Insurance Age |
Source: Public Records
Mortgage History
| Date | Status | Borrower | Loan Amount |
|---|---|---|---|
| Open | Henderson Troy J | $297,000 | |
| Closed | Henderson T J | $57,000 |
Source: Public Records
Tax History Compared to Growth
Tax History
| Year | Tax Paid | Tax Assessment Tax Assessment Total Assessment is a certain percentage of the fair market value that is determined by local assessors to be the total taxable value of land and additions on the property. | Land | Improvement |
|---|---|---|---|---|
| 2025 | $5,273 | $462,550 | $156,962 | $305,588 |
| 2024 | $4,893 | $438,350 | $129,579 | $308,771 |
| 2023 | $4,759 | $781,000 | $241,543 | $539,457 |
| 2022 | $4,609 | $421,851 | $118,718 | $303,133 |
| 2021 | $4,113 | $576,000 | $165,596 | $410,404 |
| 2020 | $3,594 | $496,000 | $149,360 | $346,640 |
| 2019 | $3,642 | $498,000 | $147,376 | $350,624 |
| 2018 | $3,433 | $461,000 | $142,598 | $318,402 |
| 2016 | $3,629 | $260,920 | $66,274 | $194,646 |
| 2015 | $4,011 | $279,235 | $66,274 | $212,961 |
| 2014 | $3,764 | $264,218 | $56,333 | $207,885 |
| 2013 | -- | $143,000 | $41,360 | $101,640 |
Source: Public Records
Map
Nearby Homes
- 825 W 1320 N
- 280 N 1100 W
- 767 W 220 N
- 1084 W Audrey Ln Unit 20
- 1084 W Audrey Ln
- 637 W 1600 N
- 790 N 500 W
- 340 N 500 W Unit 204
- 366 W 1000 N
- 789 W 1950 N
- 399 W 400 N Unit 47
- 988 W 1950 N Unit 134
- 680 W 500 S Unit 22
- 680 W 500 S Unit 17
- Carson Plan at Amberly Place
- 2050 Farmhouse Plan at Amberly Place
- Pasadena (Inactive) Plan at Amberly Place
- Portland Plan at Amberly Place
- Lincoln Farmhouse Plan at Belmont Farms
- Belmont Traditional Plan at Belmont Farms
- 829 N 900 W Unit 3
- 829 N 900 W
- 877 N 900 W Unit 1
- 877 N 900 W
- 834 N 900 W Unit 25
- 893 N 900 W
- 805 N 900 W Unit 4
- 812 N 900 W Unit 26
- 907 N 900 W
- 888 W Heritage Point Ln Unit 9
- 923 N 900 W
- 790 N 900 W
- 790 N 900 W Unit 27
- 895 Raintree Cir
- 867 Heritage Point Ln
- 889 Raintree Cir
- 937 N 900 W
- 781 N 900 W Unit 5
- 876 W 850 N Unit 10
- 811 N Vintage Cir Unit 23