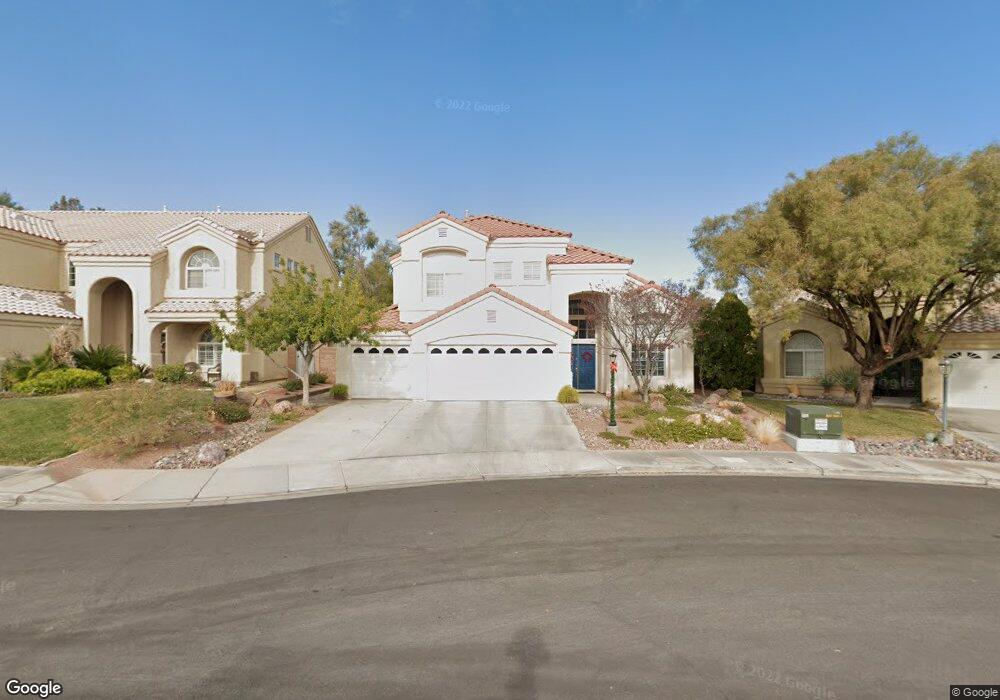
853 Rainbolt Ln Unit 2 Henderson, NV 89052
MacDonald Ranch NeighborhoodEstimated Value: $613,000 - $686,000
4
Beds
3
Baths
2,251
Sq Ft
$287/Sq Ft
Est. Value
About This Home
This home is located at 853 Rainbolt Ln Unit 2, Henderson, NV 89052 and is currently estimated at $645,717, approximately $286 per square foot. 853 Rainbolt Ln Unit 2 is a home located in Clark County with nearby schools including Frank S Lamping Elementary School, Del E. Webb Middle School, and Coronado High School.
Ownership History
Date
Name
Owned For
Owner Type
Purchase Details
Closed on
Jul 26, 2021
Sold by
Ball Jonathan Royce and Garner Ball Gina
Bought by
Ball Jonathan R and Garner Ball Gina
Current Estimated Value
Purchase Details
Closed on
Dec 3, 2014
Sold by
Garner Jason D and Garner Ball Gina Stefanelli
Bought by
Garner Ball Gina Stefanelli
Purchase Details
Closed on
May 23, 2003
Sold by
Gatley Jason and Gatley Eun Suh
Bought by
Garner Jason D and Garner Gina S
Home Financials for this Owner
Home Financials are based on the most recent Mortgage that was taken out on this home.
Original Mortgage
$277,200
Outstanding Balance
$102,506
Interest Rate
3.75%
Mortgage Type
Unknown
Estimated Equity
$543,211
Purchase Details
Closed on
Dec 16, 1998
Sold by
The Adobe Hills Ltd Partnership
Bought by
Gatley Jason and Gatley Eun Suh
Home Financials for this Owner
Home Financials are based on the most recent Mortgage that was taken out on this home.
Original Mortgage
$185,400
Interest Rate
6.86%
Create a Home Valuation Report for This Property
The Home Valuation Report is an in-depth analysis detailing your home's value as well as a comparison with similar homes in the area
Home Values in the Area
Average Home Value in this Area
Purchase History
| Date | Buyer | Sale Price | Title Company |
|---|---|---|---|
| Ball Jonathan R | -- | None Available | |
| Garner Ball Gina Stefanelli | -- | First American Title Ins | |
| Ball Jonathan Royce | -- | First American Title Ins | |
| Garner Jason D | $314,000 | First American Title Company | |
| Gatley Jason | $195,500 | United Title |
Source: Public Records
Mortgage History
| Date | Status | Borrower | Loan Amount |
|---|---|---|---|
| Open | Garner Jason D | $277,200 | |
| Previous Owner | Gatley Jason | $185,400 |
Source: Public Records
Tax History Compared to Growth
Tax History
| Year | Tax Paid | Tax Assessment Tax Assessment Total Assessment is a certain percentage of the fair market value that is determined by local assessors to be the total taxable value of land and additions on the property. | Land | Improvement |
|---|---|---|---|---|
| 2025 | $2,729 | $138,258 | $49,350 | $88,908 |
| 2024 | $2,650 | $138,258 | $49,350 | $88,908 |
| 2023 | $2,650 | $128,666 | $44,450 | $84,216 |
| 2022 | $2,573 | $119,868 | $42,700 | $77,168 |
| 2021 | $2,498 | $111,549 | $38,150 | $73,399 |
| 2020 | $2,422 | $108,895 | $36,050 | $72,845 |
| 2019 | $2,352 | $103,609 | $31,850 | $71,759 |
| 2018 | $2,205 | $94,295 | $25,200 | $69,095 |
| 2017 | $2,767 | $95,457 | $25,200 | $70,257 |
| 2016 | $2,163 | $92,153 | $21,000 | $71,153 |
| 2015 | $2,158 | $85,967 | $18,550 | $67,417 |
| 2014 | $2,095 | $77,997 | $10,150 | $67,847 |
Source: Public Records
Map
Nearby Homes
- 871 Rainbolt Ln
- 861 Majestic Ridge Ct
- 2571 Swans Chance Ave
- 2566 Wiltshire Ave
- 955 Leadville Meadows Dr
- 848 Sandhill Sage St
- 776 Valley Rise Dr
- 2548 Sundew Ave
- 861 Vegas View Dr
- 2455 Silver Blossom Ln
- 981 Leadville Meadows Dr
- 980 Upper Meadows Place
- 2556 Prince Edward Dr
- 816 Stannard Ct
- 820 Sandhill Sage St
- 818 Sandhill Sage St
- 917 Vegas View Dr
- 2266 Driftwood Tide Ave
- 830 Carnegie St Unit 1613
- 830 Carnegie St Unit 1811
- 855 Rainbolt Ln
- 851 Rainbolt Ln
- 857 Rainbolt Ln
- 850 Roanhorse Ln
- 854 Rainbolt Ln
- 859 Rainbolt Ln
- 856 Rainbolt Ln
- 852 Roanhorse Ln
- 854 Roanhorse Ln
- 860 Rainbolt Ln Unit 1
- 858 Binbrook Dr
- 856 Binbrook Dr
- 854 Binbrook Dr
- 860 Binbrook Dr
- 852 Binbrook Dr
- 857 Roanhorse Ln
- 856 Roanhorse Ln
- 863 Rainbolt Ln
- 862 Rainbolt Ln
- 850 Binbrook Dr