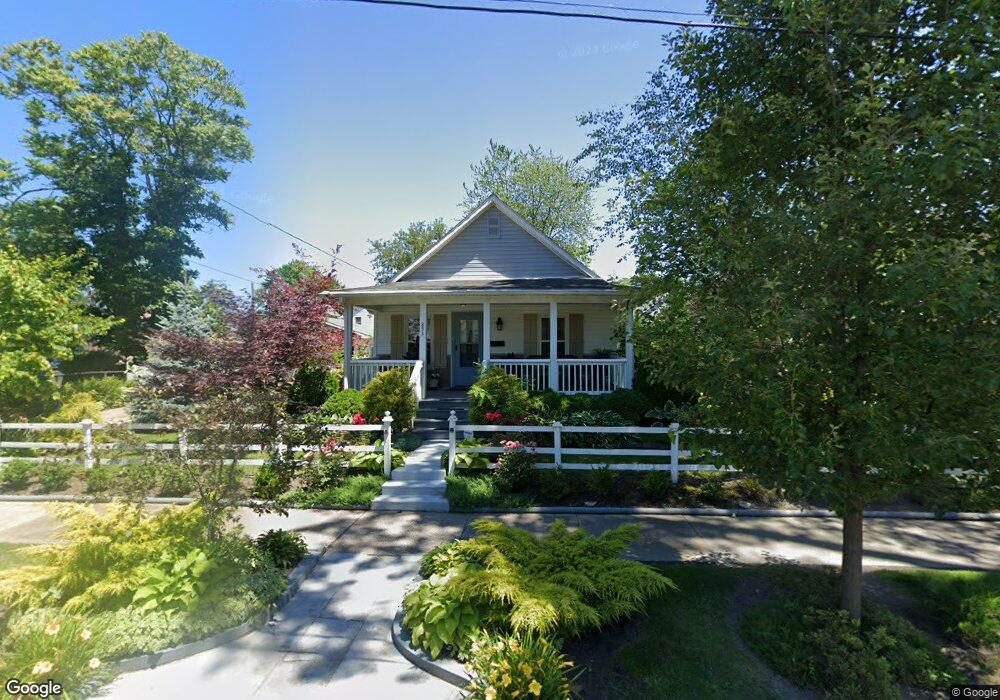
853 Yondota St Toledo, OH 43605
East Toledo NeighborhoodEstimated Value: $48,000 - $93,000
2
Beds
1
Bath
924
Sq Ft
$79/Sq Ft
Est. Value
About This Home
This home is located at 853 Yondota St, Toledo, OH 43605 and is currently estimated at $72,998, approximately $79 per square foot. 853 Yondota St is a home located in Lucas County with nearby schools including Navarre Elementary School, Waite High School, and L. Hollingworth School For Talented And Gifted.
Ownership History
Date
Name
Owned For
Owner Type
Purchase Details
Closed on
Oct 30, 2003
Sold by
Riccardi Vincent
Bought by
Neighborhood Housing Svcs Of Toledo Inc
Current Estimated Value
Purchase Details
Closed on
Apr 24, 2002
Sold by
Amelia Williams
Bought by
Riccardi Vincent
Purchase Details
Closed on
Feb 10, 1999
Sold by
Williams Amelia
Bought by
Riccardi Vincent
Home Financials for this Owner
Home Financials are based on the most recent Mortgage that was taken out on this home.
Original Mortgage
$18,500
Interest Rate
10%
Mortgage Type
Seller Take Back
Create a Home Valuation Report for This Property
The Home Valuation Report is an in-depth analysis detailing your home's value as well as a comparison with similar homes in the area
Home Values in the Area
Average Home Value in this Area
Purchase History
| Date | Buyer | Sale Price | Title Company |
|---|---|---|---|
| Neighborhood Housing Svcs Of Toledo Inc | $18,500 | -- | |
| Riccardi Vincent | $18,500 | -- | |
| Riccardi Vincent | $18,500 | -- |
Source: Public Records
Mortgage History
| Date | Status | Borrower | Loan Amount |
|---|---|---|---|
| Previous Owner | Riccardi Vincent | $18,500 |
Source: Public Records
Tax History Compared to Growth
Tax History
| Year | Tax Paid | Tax Assessment Tax Assessment Total Assessment is a certain percentage of the fair market value that is determined by local assessors to be the total taxable value of land and additions on the property. | Land | Improvement |
|---|---|---|---|---|
| 2024 | $260 | $11,620 | $3,640 | $7,980 |
| 2023 | $552 | $11,690 | $3,675 | $8,015 |
| 2022 | $585 | $11,690 | $3,675 | $8,015 |
| 2021 | $560 | $11,690 | $3,675 | $8,015 |
| 2020 | $491 | $10,255 | $3,185 | $7,070 |
| 2019 | $515 | $10,255 | $3,185 | $7,070 |
| 2018 | $666 | $10,255 | $3,185 | $7,070 |
| 2017 | $1,137 | $10,010 | $3,115 | $6,895 |
| 2016 | $859 | $18,400 | $8,900 | $9,500 |
| 2015 | $842 | $18,400 | $8,900 | $9,500 |
| 2014 | $408 | $6,310 | $3,050 | $3,260 |
| 2013 | $408 | $6,310 | $3,050 | $3,260 |
Source: Public Records
Map
Nearby Homes