B
Seller's Agent in 2017
Beth Seim
Inactive Office

Estimated Value: $100,000 - $152,771
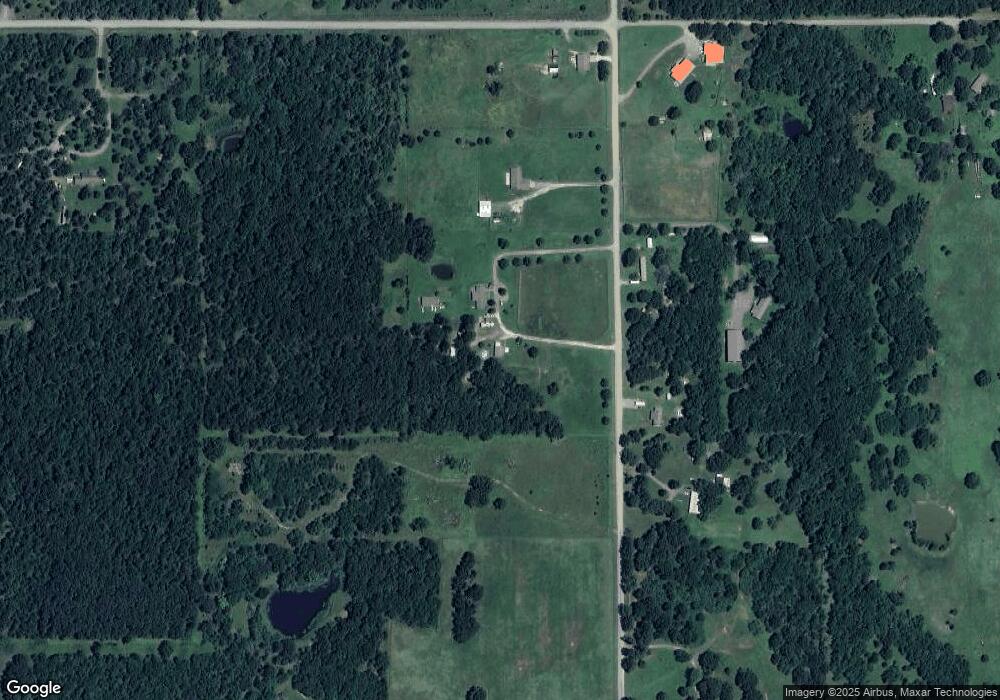
Bungalow on 5 acres! 12x20 Horse Barn, 20x20 concrete slab garage/workshop, partially wooded, fenced & cross fenced w/private gated drive. Open living, dining & kitchen with inside laundry area. Plenty of deer & quite space. Make your appt to see today!
Last Agent to Sell the Property
Beth Seim
Inactive Office License #158468 Listed on: 05/16/2016
Last Buyer's Agent
Beth Seim
Inactive Office License #158468 Listed on: 05/16/2016
| Date | Buyer | Sale Price | Title Company |
|---|---|---|---|
| Johnson Jeremy | $58,000 | None Available | |
| -- | -- | -- |
| Date | Status | Borrower | Loan Amount |
|---|---|---|---|
| Open | Johnson Jeremy | $58,585 |
| Date | Event | Price | List to Sale | Price per Sq Ft |
|---|---|---|---|---|
| 01/25/2017 01/25/17 | Sold | $58,000 | +0.9% | $81 / Sq Ft |
| 05/16/2016 05/16/16 | Pending | -- | -- | -- |
| 05/16/2016 05/16/16 | For Sale | $57,500 | -- | $80 / Sq Ft |
| Year | Tax Paid | Tax Assessment Tax Assessment Total Assessment is a certain percentage of the fair market value that is determined by local assessors to be the total taxable value of land and additions on the property. | Land | Improvement |
|---|---|---|---|---|
| 2025 | $826 | $7,599 | $1,870 | $5,729 |
| 2024 | $773 | $7,599 | $1,870 | $5,729 |
| 2023 | $773 | $7,599 | $1,650 | $5,949 |
| 2022 | $648 | $6,517 | $1,650 | $4,867 |
| 2021 | $651 | $6,517 | $1,650 | $4,867 |
| 2020 | $661 | $6,517 | $1,650 | $4,867 |
| 2019 | $652 | $6,517 | $1,650 | $4,867 |
| 2018 | $660 | $6,391 | $1,650 | $4,741 |
| 2017 | $550 | $6,246 | $1,650 | $4,596 |
| 2016 | $531 | $6,246 | $1,650 | $4,596 |
| 2015 | $531 | $6,246 | $1,650 | $4,596 |
| 2014 | $1 | $6,246 | $1,650 | $4,596 |
B
Seller's Agent in 2017
Beth Seim
Inactive Office
Source: MLS Technology
MLS Number: 1616728
APN: 50095
Disclaimer: Certain information contained herein is derived from information provided by parties other than Homes.com. All information provided is deemed reliable, but is not guaranteed to be accurate and should be independently verified.
![]() IDX information is provided exclusively for personal, non-commercial use, and may not be used for any purpose other than to identify prospective properties consumers may be interested in purchasing.
IDX information is provided exclusively for personal, non-commercial use, and may not be used for any purpose other than to identify prospective properties consumers may be interested in purchasing.
Information is deemed reliable but not guaranteed.
Ask me questions while you tour the home.