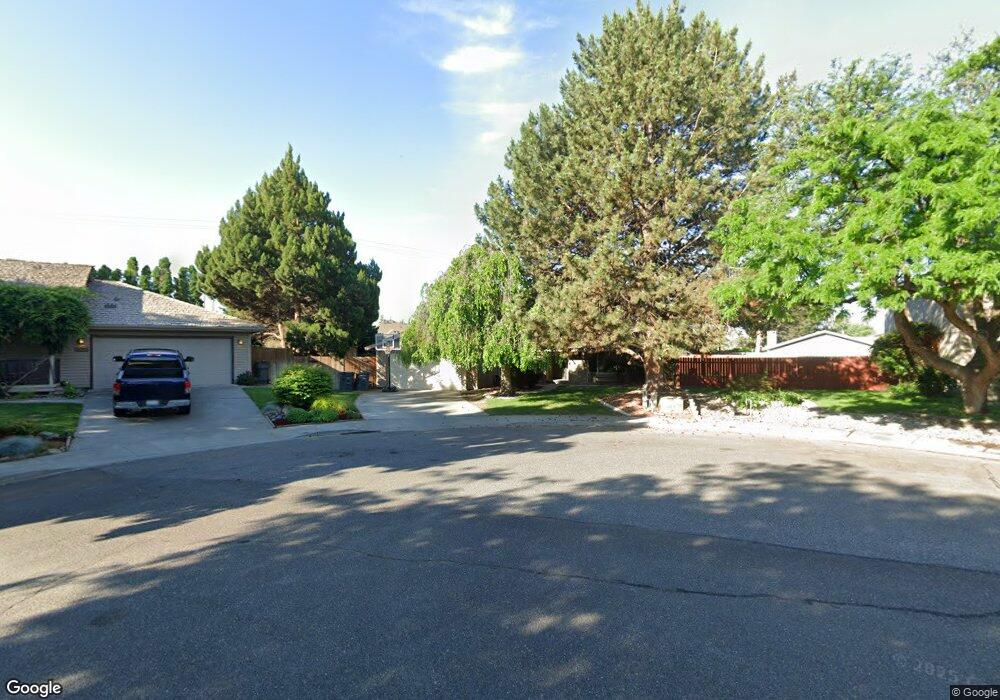
8533 W Deschutes Ave Kennewick, WA 99336
Estimated Value: $347,000 - $399,000
3
Beds
2
Baths
1,254
Sq Ft
$299/Sq Ft
Est. Value
About This Home
This home is located at 8533 W Deschutes Ave, Kennewick, WA 99336 and is currently estimated at $375,426, approximately $299 per square foot. 8533 W Deschutes Ave is a home located in Benton County with nearby schools including Sunset View Elementary School, Desert Hills Middle School, and Kamiakin High School.
Ownership History
Date
Name
Owned For
Owner Type
Purchase Details
Closed on
Feb 8, 2021
Sold by
Mccormick Scott
Bought by
Mccormick Scott D and Wilde Timoney B
Current Estimated Value
Home Financials for this Owner
Home Financials are based on the most recent Mortgage that was taken out on this home.
Original Mortgage
$175,000
Outstanding Balance
$156,247
Interest Rate
2.6%
Mortgage Type
New Conventional
Estimated Equity
$219,179
Purchase Details
Closed on
Feb 7, 2011
Sold by
S & S Services Group Llc
Bought by
Mccormick Scott
Home Financials for this Owner
Home Financials are based on the most recent Mortgage that was taken out on this home.
Original Mortgage
$144,248
Interest Rate
4.62%
Mortgage Type
FHA
Purchase Details
Closed on
Aug 28, 2009
Sold by
Graves Rose Ann
Bought by
S & S Services Group Llc
Create a Home Valuation Report for This Property
The Home Valuation Report is an in-depth analysis detailing your home's value as well as a comparison with similar homes in the area
Home Values in the Area
Average Home Value in this Area
Purchase History
| Date | Buyer | Sale Price | Title Company |
|---|---|---|---|
| Mccormick Scott D | -- | Cascade Title Co | |
| Mccormick Scott | $148,000 | Benton Franklin Title Co | |
| Mccormick Scott | -- | Benton Franklin Title Co | |
| S & S Services Group Llc | $90,000 | Cascade Title |
Source: Public Records
Mortgage History
| Date | Status | Borrower | Loan Amount |
|---|---|---|---|
| Open | Mccormick Scott D | $175,000 | |
| Closed | Mccormick Scott | $144,248 |
Source: Public Records
Tax History Compared to Growth
Tax History
| Year | Tax Paid | Tax Assessment Tax Assessment Total Assessment is a certain percentage of the fair market value that is determined by local assessors to be the total taxable value of land and additions on the property. | Land | Improvement |
|---|---|---|---|---|
| 2024 | $2,202 | $286,660 | $70,000 | $216,660 |
| 2023 | $2,202 | $273,530 | $70,000 | $203,530 |
| 2022 | $2,044 | $227,570 | $70,000 | $157,570 |
| 2021 | $1,838 | $207,880 | $70,000 | $137,880 |
| 2020 | $1,868 | $181,030 | $40,000 | $141,030 |
| 2019 | $1,628 | $176,160 | $40,000 | $136,160 |
| 2018 | $1,741 | $156,710 | $40,000 | $116,710 |
| 2017 | $1,590 | $137,260 | $40,000 | $97,260 |
| 2016 | $1,616 | $137,260 | $40,000 | $97,260 |
| 2015 | $1,631 | $137,260 | $40,000 | $97,260 |
| 2014 | -- | $137,440 | $34,000 | $103,440 |
| 2013 | -- | $137,440 | $34,000 | $103,440 |
Source: Public Records
Map
Nearby Homes
- 8537 W Deschutes Ave
- 8210 W Clearwater Place
- 8819 W Deschutes Dr
- 8415 W Entiat Place
- 8712 W Entiat Ave
- 407 N Kansas St
- 500 N Kansas St
- 8704 W Hood Ave
- 8901 W Hood Ave
- 8608 W Imnaha Ave
- 708 N Nevada Ct
- 9014 W Grand Ronde Ave
- 8820 W Imnaha Ct
- 7901 W Clearwater Ave Unit 145
- 7901 W Clearwater Ave Unit 182
- 7901 W Clearwater Ave Unit 137
- 7901 W Clearwater Ave Unit 167
- 7901 W Clearwater Ave Unit 124
- 7901 W Clearwater Ave Unit 120
- 7901 W Clearwater Ave Unit 154
- 220 N Undetermined St
- 8601 W Deschutes Ave
- 8529 W Deschutes Ave
- 8518 W Clearwater Place
- 8514 W Clearwater Place
- 8600 W Clearwater Place
- 8607 W Deschutes Ave
- 8510 W Clearwater Place
- 8525 W Deschutes Ave
- 8521 W Deschutes Ave
- 8517 W Deschutes Ave
- 8608 W Clearwater Place
- 8506 W Clearwater Place
- 8530 W Deschutes Ave
- 8600 W Deschutes Ave Unit NEW CARPET & PAINT
- 8600 W Deschutes Ave Unit Great Home! Great Pr
- 8600 W Deschutes Ave
- 8613 W Deschutes Ave
- 8526 W Deschutes Ave
- 8517 W Clearwater Place