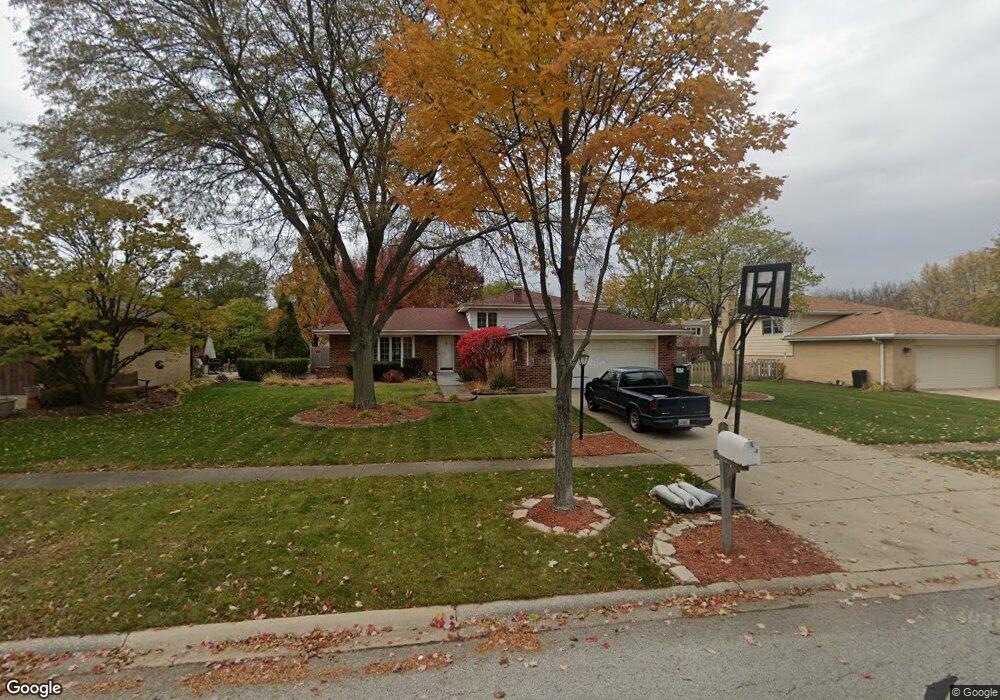
8534 Beller Ct Darien, IL 60561
South Woodridge NeighborhoodEstimated Value: $406,685 - $490,000
3
Beds
2
Baths
1,300
Sq Ft
$352/Sq Ft
Est. Value
About This Home
This home is located at 8534 Beller Ct, Darien, IL 60561 and is currently estimated at $457,671, approximately $352 per square foot. 8534 Beller Ct is a home located in DuPage County with nearby schools including Prairieview Elementary School, Elizabeth Ide Elementary School, and Lakeview Jr High School.
Ownership History
Date
Name
Owned For
Owner Type
Purchase Details
Closed on
Dec 2, 2003
Sold by
Daly John M and Daly Angela D
Bought by
Klamer Kenneth K and Klamer Jaime J
Current Estimated Value
Home Financials for this Owner
Home Financials are based on the most recent Mortgage that was taken out on this home.
Original Mortgage
$236,000
Outstanding Balance
$111,036
Interest Rate
6.1%
Mortgage Type
Purchase Money Mortgage
Estimated Equity
$346,635
Purchase Details
Closed on
Sep 20, 1999
Sold by
Daly John M and Wolfgang Angela D
Bought by
Daly John M and Daly Angela D
Purchase Details
Closed on
Mar 30, 1999
Sold by
Knecht Karl J and Knecht Maria B
Bought by
Daly John M and Wolfgang Angela D
Home Financials for this Owner
Home Financials are based on the most recent Mortgage that was taken out on this home.
Original Mortgage
$188,000
Interest Rate
6.89%
Create a Home Valuation Report for This Property
The Home Valuation Report is an in-depth analysis detailing your home's value as well as a comparison with similar homes in the area
Home Values in the Area
Average Home Value in this Area
Purchase History
| Date | Buyer | Sale Price | Title Company |
|---|---|---|---|
| Klamer Kenneth K | $295,000 | Chicago Title Insurance Comp | |
| Daly John M | -- | -- | |
| Daly John M | $198,000 | -- |
Source: Public Records
Mortgage History
| Date | Status | Borrower | Loan Amount |
|---|---|---|---|
| Open | Klamer Kenneth K | $236,000 | |
| Previous Owner | Daly John M | $188,000 |
Source: Public Records
Tax History Compared to Growth
Tax History
| Year | Tax Paid | Tax Assessment Tax Assessment Total Assessment is a certain percentage of the fair market value that is determined by local assessors to be the total taxable value of land and additions on the property. | Land | Improvement |
|---|---|---|---|---|
| 2024 | $7,184 | $124,389 | $55,238 | $69,151 |
| 2023 | $6,888 | $114,350 | $50,780 | $63,570 |
| 2022 | $6,470 | $107,000 | $48,320 | $58,680 |
| 2021 | $5,940 | $105,780 | $47,770 | $58,010 |
| 2020 | $5,837 | $103,680 | $46,820 | $56,860 |
| 2019 | $5,642 | $99,480 | $44,920 | $54,560 |
| 2018 | $5,560 | $96,310 | $44,670 | $51,640 |
| 2017 | $5,361 | $92,670 | $42,980 | $49,690 |
| 2016 | $5,767 | $99,190 | $40,950 | $58,240 |
| 2015 | $5,676 | $93,320 | $38,530 | $54,790 |
| 2014 | $5,571 | $90,730 | $37,460 | $53,270 |
| 2013 | $5,637 | $90,300 | $37,280 | $53,020 |
Source: Public Records
Map
Nearby Homes
- 8547 Harvest Ln
- 3145 Hillside Ln
- 8498 Cornelia Ln
- 8557 Sandalwood Dr
- 8539 Sperry Ct
- 8543 Sperry Ct
- 8551 Sperry Ct
- 2845 87th St
- 8269 Meadowwood Ave
- 1340 83rd St
- Danbury II Plan at The Townes at Farmingdale
- Brighton Plan at The Townes at Farmingdale
- Braeden Plan at The Townes at Farmingdale
- Campbell Plan at The Townes at Farmingdale
- 8497 Liberty Ln
- 1858 Fulton St
- 1850 Fulton St
- 1846 Fulton St
- 8538 Sperry Ct
- 8537 Chadwick Ct
- 8546 Beller Ct
- 8535 Wood Vale Dr
- 8547 Wood Vale Dr
- 8558 Beller Ct
- 8523 Wood Vale Dr
- 8559 Wood Vale Dr
- 8535 Beller Ct
- 8523 Beller Ct
- 8547 Beller Ct
- 8571 Wood Vale Dr
- 8570 Beller Ct
- 8559 Beller Ct
- 3120 Beller Dr
- 3130 Beller Dr Unit 2
- 3110 Beller Dr
- 8583 Wood Vale Dr
- 8582 Beller Ct
- 8571 Beller Ct
- 3140 Beller Dr
- 8530 Wood Vale Dr