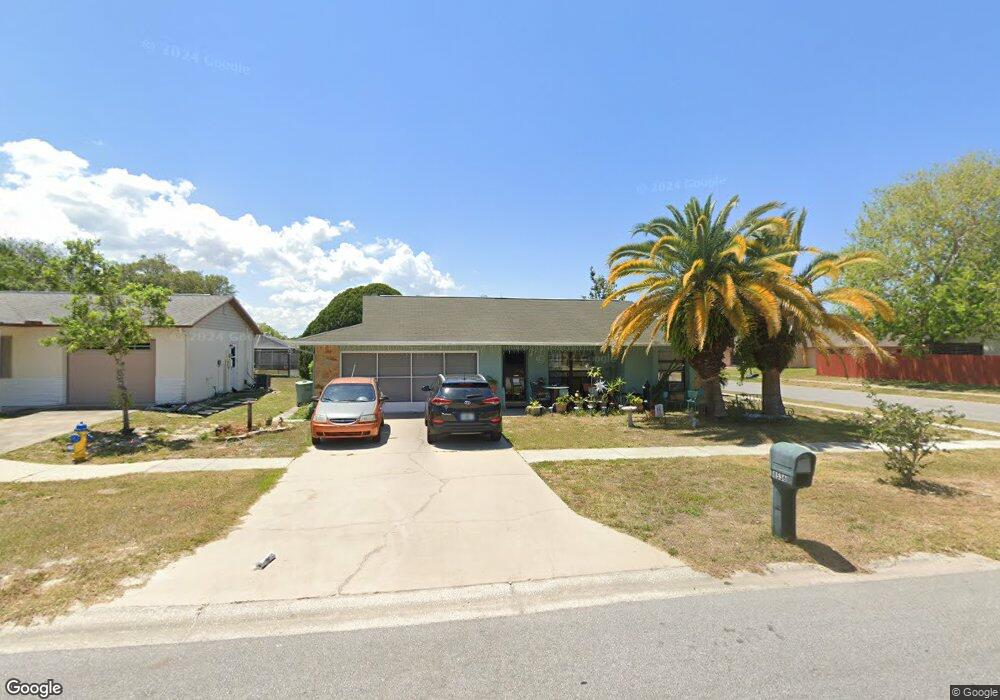
8536 Schrader Blvd Port Richey, FL 34668
Estimated Value: $228,000 - $274,000
3
Beds
2
Baths
1,559
Sq Ft
$163/Sq Ft
Est. Value
About This Home
This home is located at 8536 Schrader Blvd, Port Richey, FL 34668 and is currently estimated at $253,990, approximately $162 per square foot. 8536 Schrader Blvd is a home located in Pasco County with nearby schools including Schrader Elementary School, Bayonet Point Middle School, and Fivay High School.
Ownership History
Date
Name
Owned For
Owner Type
Purchase Details
Closed on
Jul 24, 2020
Sold by
Pirkle Randall Keith
Bought by
Lamparski Richard A and Lamparski Victoria
Current Estimated Value
Home Financials for this Owner
Home Financials are based on the most recent Mortgage that was taken out on this home.
Original Mortgage
$127,325
Outstanding Balance
$113,113
Interest Rate
3.2%
Mortgage Type
FHA
Estimated Equity
$140,877
Purchase Details
Closed on
Aug 16, 2006
Sold by
Meukel Vincent E and Meukel Brenda A
Bought by
Pirkle Jerry
Purchase Details
Closed on
Apr 16, 1999
Sold by
Eugene A Schauer Tr
Bought by
Meukel Vincent E and Meukel Brenda A
Home Financials for this Owner
Home Financials are based on the most recent Mortgage that was taken out on this home.
Original Mortgage
$65,692
Interest Rate
7.08%
Mortgage Type
FHA
Create a Home Valuation Report for This Property
The Home Valuation Report is an in-depth analysis detailing your home's value as well as a comparison with similar homes in the area
Home Values in the Area
Average Home Value in this Area
Purchase History
| Date | Buyer | Sale Price | Title Company |
|---|---|---|---|
| Lamparski Richard A | $129,700 | Somers Title Company | |
| Pirkle Jerry | $135,000 | Security First Title Partner | |
| Meukel Vincent E | $65,900 | -- |
Source: Public Records
Mortgage History
| Date | Status | Borrower | Loan Amount |
|---|---|---|---|
| Open | Lamparski Richard A | $127,325 | |
| Previous Owner | Meukel Vincent E | $35,000 | |
| Previous Owner | Meukel Vincent E | $65,692 |
Source: Public Records
Tax History Compared to Growth
Tax History
| Year | Tax Paid | Tax Assessment Tax Assessment Total Assessment is a certain percentage of the fair market value that is determined by local assessors to be the total taxable value of land and additions on the property. | Land | Improvement |
|---|---|---|---|---|
| 2025 | $3,227 | $217,666 | $42,404 | $175,262 |
| 2024 | $3,227 | $221,574 | $42,404 | $179,170 |
| 2023 | $3,150 | $217,953 | $30,419 | $187,534 |
| 2022 | $2,744 | $184,433 | $25,421 | $159,012 |
| 2021 | $2,355 | $133,617 | $19,303 | $114,314 |
| 2020 | $1,977 | $124,125 | $11,616 | $112,509 |
| 2019 | $1,821 | $111,429 | $11,616 | $99,813 |
| 2018 | $1,643 | $97,508 | $11,616 | $85,892 |
| 2017 | $1,460 | $76,655 | $11,616 | $65,039 |
| 2016 | $1,362 | $73,697 | $11,616 | $62,081 |
| 2015 | $1,259 | $64,619 | $11,616 | $53,003 |
| 2014 | $1,159 | $60,370 | $11,361 | $49,009 |
Source: Public Records
Map
Nearby Homes
- 11516 Versailles Ln
- 11508 Orleans Ln Unit C
- 11403 Versailles Ln Unit E
- 8350 High Point Cir Unit 3
- 11241 Versailles Ln
- 8518 Huntsman Ln
- 11633 Fox Run
- 8330 High Point Cir Unit 6
- 8320 High Point Cir Unit 5
- 8611 Gandy Ln
- 11543 Orleans Ln Unit 11543
- 11541 Orleans Ln Unit 15A
- 8530 Zane Ln
- 11231 Dollar Lake Dr Unit 1
- 11231 Dollar Lake Dr Unit 6
- 11134 Island Pine Dr
- 11311 Dollar Lake Dr Unit 6
- 11744 La Madera Blvd
- 11241 Dollar Lake Dr Unit 5
- 11127 Water Oak Dr
- 8542 Schrader Blvd
- 11440 Brown Bear Ln
- 8526 Schrader Blvd
- 8604 Schrader Blvd
- 11434 Brown Bear Ln
- 11443 Brown Bear Ln
- 8533 Schrader Blvd
- 8539 Schrader Blvd
- 8610 Schrader Blvd
- 8520 Schrader Blvd
- 8527 Schrader Blvd
- 8601 Schrader Blvd
- 11428 Brown Bear Ln
- 11437 Brown Bear Ln
- 8521 Schrader Blvd
- 8605 Schrader Blvd
- 8614 Schrader Blvd
- 11433 Brown Bear Ln
- 11436 Nature Trail