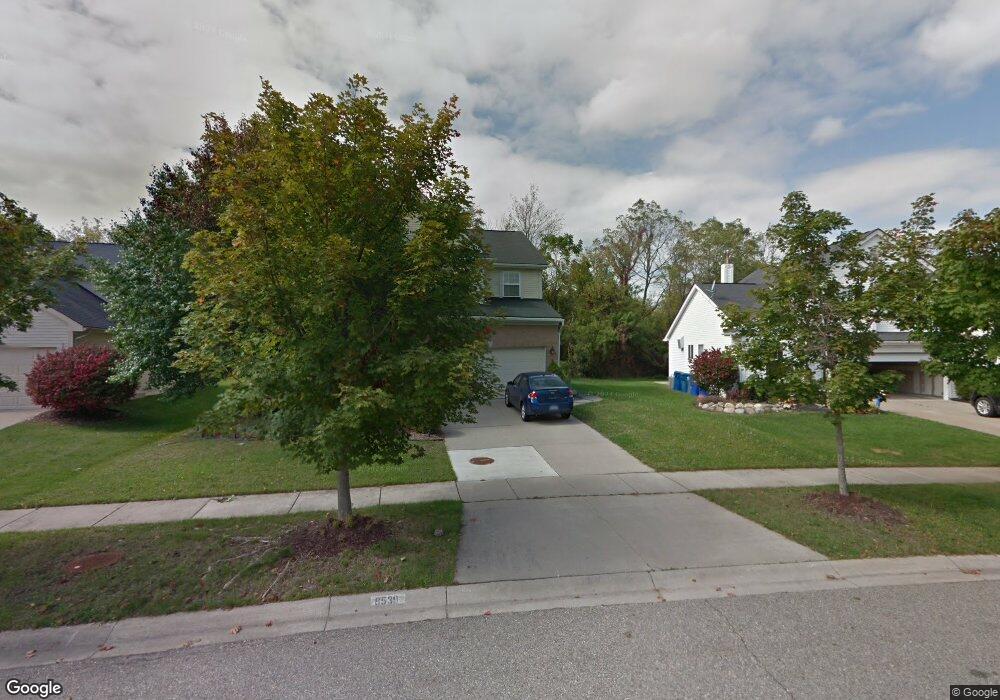
8539 Barrington Dr Unit 21 Ypsilanti, MI 48198
Estimated Value: $398,000 - $479,000
4
Beds
3
Baths
2,368
Sq Ft
$184/Sq Ft
Est. Value
About This Home
This home is located at 8539 Barrington Dr Unit 21, Ypsilanti, MI 48198 and is currently estimated at $436,872, approximately $184 per square foot. 8539 Barrington Dr Unit 21 is a home located in Washtenaw County with nearby schools including Holmes Elementary School, Erickson Elementary School, and Estabrook Elementary School.
Ownership History
Date
Name
Owned For
Owner Type
Purchase Details
Closed on
Apr 23, 2019
Sold by
Moon Sarah and Moon Stephanie
Bought by
Moon Sarah K and Moon Stephanie L
Current Estimated Value
Purchase Details
Closed on
May 30, 2008
Sold by
Kelsch Kevin and Kelsch Dawn
Bought by
Moon Sarah and Totty Stephanie
Home Financials for this Owner
Home Financials are based on the most recent Mortgage that was taken out on this home.
Original Mortgage
$180,573
Outstanding Balance
$115,636
Interest Rate
6.01%
Mortgage Type
FHA
Estimated Equity
$321,236
Purchase Details
Closed on
Nov 18, 2003
Sold by
Osness Kenneth and Osness Jennifer A
Bought by
Kelsch Kevin M and Kelsch Dawn M
Home Financials for this Owner
Home Financials are based on the most recent Mortgage that was taken out on this home.
Original Mortgage
$175,000
Interest Rate
5%
Mortgage Type
Unknown
Purchase Details
Closed on
Dec 21, 2001
Sold by
L L C Selective - Delaware
Bought by
Osness Kenneth
Create a Home Valuation Report for This Property
The Home Valuation Report is an in-depth analysis detailing your home's value as well as a comparison with similar homes in the area
Home Values in the Area
Average Home Value in this Area
Purchase History
| Date | Buyer | Sale Price | Title Company |
|---|---|---|---|
| Moon Sarah K | -- | None Available | |
| Moon Sarah | $182,000 | None Available | |
| Kelsch Kevin M | $240,000 | Ct | |
| Osness Kenneth | -- | -- |
Source: Public Records
Mortgage History
| Date | Status | Borrower | Loan Amount |
|---|---|---|---|
| Open | Moon Sarah | $180,573 | |
| Previous Owner | Kelsch Kevin M | $175,000 | |
| Closed | Kelsch Kevin M | $50,000 |
Source: Public Records
Tax History Compared to Growth
Tax History
| Year | Tax Paid | Tax Assessment Tax Assessment Total Assessment is a certain percentage of the fair market value that is determined by local assessors to be the total taxable value of land and additions on the property. | Land | Improvement |
|---|---|---|---|---|
| 2025 | $4,176 | $212,500 | $0 | $0 |
| 2024 | $2,703 | $192,300 | $0 | $0 |
| 2023 | $3,132 | $170,400 | $0 | $0 |
| 2022 | $4,015 | $149,600 | $0 | $0 |
| 2021 | $3,902 | $146,800 | $0 | $0 |
| 2020 | $3,860 | $143,000 | $0 | $0 |
| 2019 | $3,760 | $120,100 | $120,100 | $0 |
| 2018 | $3,384 | $109,200 | $12,500 | $96,700 |
| 2017 | $3,214 | $107,200 | $0 | $0 |
| 2016 | $2,446 | $74,605 | $0 | $0 |
| 2015 | $2,980 | $74,382 | $0 | $0 |
| 2014 | $2,980 | $70,800 | $0 | $0 |
| 2013 | -- | $70,800 | $0 | $0 |
Source: Public Records
Map
Nearby Homes
- 8543 Barrington Dr
- 8522 Berkshire Dr
- 8842 Somerset Ln Unit 346
- 1961 Elizabeth Ln
- 1964 Elizabeth Ln
- 1875 Sheffield Dr
- 1925 Sheffield Dr
- 8380 Lakeview Dr Unit 55
- 8346 Lakeview Dr Unit 69
- 1794 Hamlet Dr
- 7603 Abigail Dr
- 8280 S Warwick Ct Unit 143
- 8262 S Warwick Ct Unit 137
- 1735 Savannah Ln
- 7518 Myrtle Ct
- The Austin Plan at The Estates at Hutsfield
- The Harrison Plan at The Estates at Hutsfield
- The Davenport Plan at The Estates at Hutsfield
- The Columbia Plan at The Estates at Hutsfield
- The Bloomington Plan at The Estates at Hutsfield
- 8533 Barrington Dr Unit 22
- 8529 Barrington Dr
- 8547 Barrington Dr
- 8536 Barrington Dr Unit 32
- 8525 Barrington Dr
- 8551 Barrington Dr
- 8530 Barrington Dr Unit 31
- 8540 Barrington Dr
- 8522 Barrington Dr
- 8523 Barrington Dr Unit 25
- 8555 Barrington Dr
- 8544 Barrington Dr Unit 34
- 8559 Barrington Dr Unit 16
- 8560 Barrington Dr
- 8517 Barrington Dr
- 8563 Barrington Dr Unit 15
- 8568 Barrington Dr
- 8513 Barrington Dr
- 8569 Barrington Dr Unit 14
- 8391 Stamford Dr