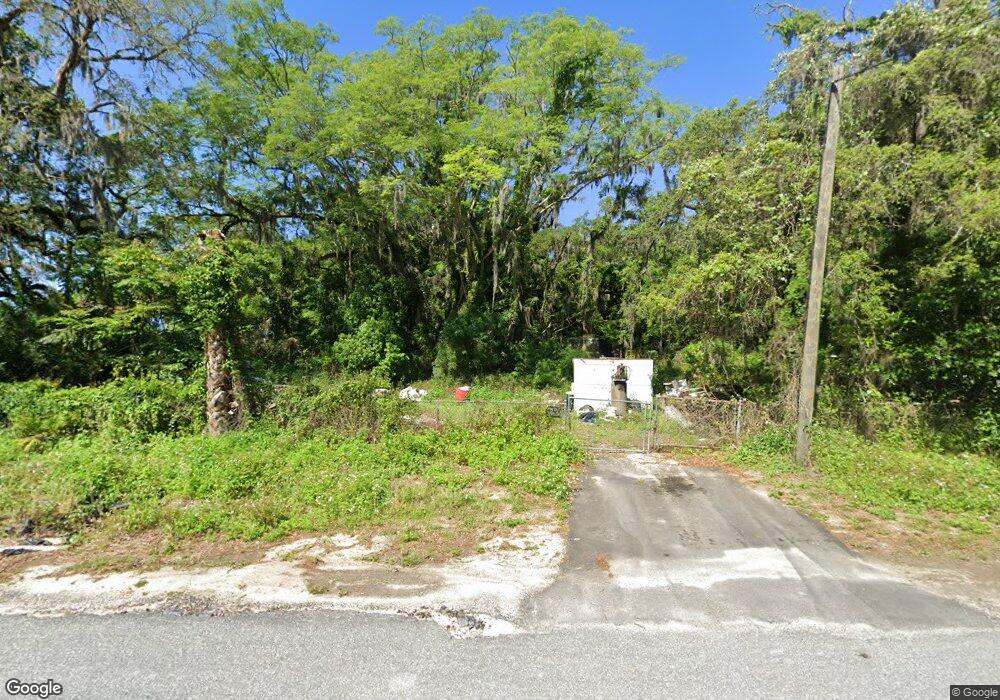
8539 Broad St New Port Richey, FL 34654
Estimated Value: $203,549 - $250,000
2
Beds
1
Bath
1,356
Sq Ft
$170/Sq Ft
Est. Value
About This Home
This home is located at 8539 Broad St, New Port Richey, FL 34654 and is currently estimated at $231,137, approximately $170 per square foot. 8539 Broad St is a home located in Pasco County with nearby schools including Cypress Elementary School, River Ridge High School, and River Ridge Middle School.
Ownership History
Date
Name
Owned For
Owner Type
Purchase Details
Closed on
May 13, 2025
Sold by
Erardi Patricia and Cooley Patricia Giulia
Bought by
Hsi Asset Securitization Corporation Trust and Deutsche Bank National Trust
Current Estimated Value
Purchase Details
Closed on
Nov 25, 2005
Sold by
Berardi Pasquale and Berardi Prudence
Bought by
Cooley Kenneth K and Cooley Patricia
Home Financials for this Owner
Home Financials are based on the most recent Mortgage that was taken out on this home.
Original Mortgage
$114,000
Interest Rate
9.75%
Mortgage Type
Unknown
Purchase Details
Closed on
Aug 2, 2000
Sold by
White Virgil L and White Naomi E
Bought by
Berardi Pasquale and Berardi Prudence
Home Financials for this Owner
Home Financials are based on the most recent Mortgage that was taken out on this home.
Original Mortgage
$70,000
Interest Rate
8.12%
Mortgage Type
Balloon
Create a Home Valuation Report for This Property
The Home Valuation Report is an in-depth analysis detailing your home's value as well as a comparison with similar homes in the area
Home Values in the Area
Average Home Value in this Area
Purchase History
| Date | Buyer | Sale Price | Title Company |
|---|---|---|---|
| Hsi Asset Securitization Corporation Trust | $53,100 | -- | |
| Hsi Asset Securitization Corporation Trust | $53,100 | -- | |
| Cooley Kenneth K | $114,000 | None Available | |
| Berardi Pasquale | $71,000 | -- |
Source: Public Records
Mortgage History
| Date | Status | Borrower | Loan Amount |
|---|---|---|---|
| Previous Owner | Cooley Kenneth K | $114,000 | |
| Previous Owner | Berardi Pasquale | $70,000 |
Source: Public Records
Tax History Compared to Growth
Tax History
| Year | Tax Paid | Tax Assessment Tax Assessment Total Assessment is a certain percentage of the fair market value that is determined by local assessors to be the total taxable value of land and additions on the property. | Land | Improvement |
|---|---|---|---|---|
| 2025 | $2,347 | $143,106 | $53,000 | $90,106 |
| 2024 | $2,347 | $137,574 | $53,000 | $84,574 |
| 2023 | $2,106 | $109,150 | $0 | $0 |
| 2022 | $1,815 | $128,777 | $53,000 | $75,777 |
| 2021 | $1,535 | $90,599 | $47,500 | $43,099 |
| 2020 | $1,403 | $82,013 | $40,000 | $42,013 |
| 2019 | $1,347 | $82,635 | $40,000 | $42,635 |
| 2018 | $1,279 | $81,577 | $40,000 | $41,577 |
| 2017 | $1,112 | $61,638 | $40,000 | $21,638 |
| 2016 | $1,083 | $61,243 | $40,000 | $21,243 |
| 2015 | $1,092 | $60,528 | $40,000 | $20,528 |
| 2014 | $1,055 | $59,955 | $40,000 | $19,955 |
Source: Public Records
Map
Nearby Homes
- 8617 Broad St
- 0 0 Unit MFRTB8421780
- 8528 Thrasher Ct
- 8518 Thrasher Ct
- 8741 Planters Ln
- 8531 Bass Lake Dr
- 8522 Cranes Roost Dr
- 8823 Crescent Forest Blvd
- 8711 Crescent Forest Blvd
- 8057 Moonlight Ln
- 9217 Maynard Ave
- 9210 Maynard Ave
- 9215 Ridge Rd
- 0 Royal Palm Ave Unit MFRW7858646
- 7623 Radcliffe Cir Unit A112
- 7623 Radcliffe Cir Unit 211A
- 8225 Arevee Dr Unit 819
- 8225 Arevee Dr Unit 334
- 8225 Arevee Dr Unit 363
- 8225 Arevee Dr
- 8546 Broad St
- 8606 Broad St
- 8607 Broad St
- 8645 Ridge Rd
- 8636 Adonis Rd
- 8539 Ridge Rd
- 8640 Adonis Rd
- 8548 Grave Ave Unit 2
- 8562 Adonis Rd
- 8540 Adonis Rd
- 8621 Cameo Dr
- 8660 Ridge Rd
- 8529 Grave Ave
- 8719 Worrell Dr
- 8545 Grave Ave
- 8654 Cameo Dr
- 0 Flair Ave Unit Lake Worrell Acres-L
- 8535 Adonis Rd
- 8725 Worrell Dr
- 8650 Broad St