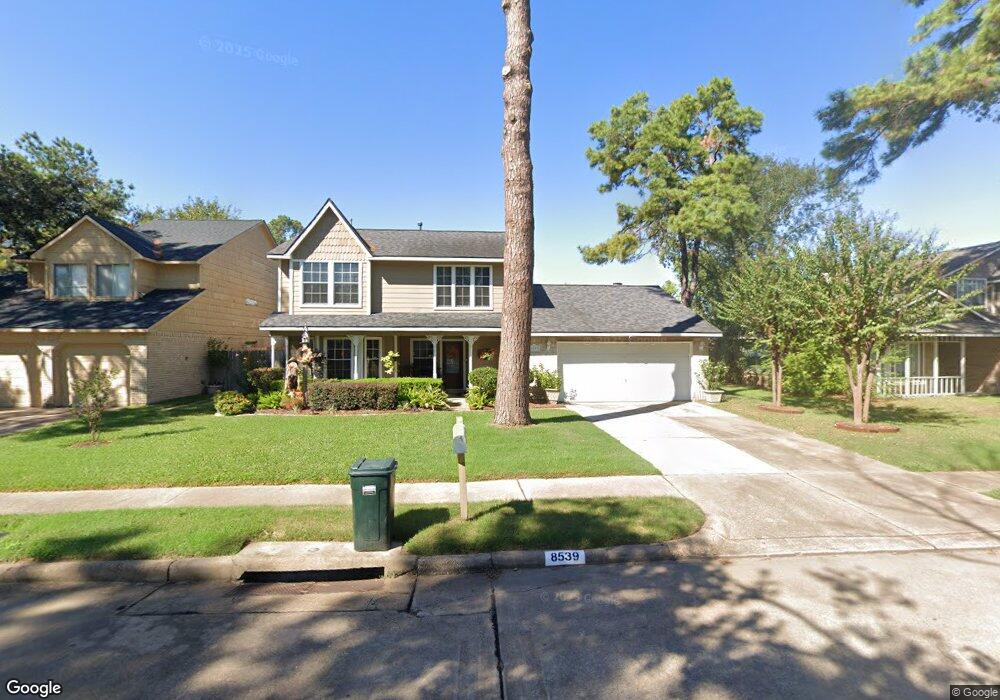
8539 Lake Crystal Dr Houston, TX 77095
Estimated Value: $249,055 - $276,000
3
Beds
3
Baths
1,730
Sq Ft
$153/Sq Ft
Est. Value
About This Home
This home is located at 8539 Lake Crystal Dr, Houston, TX 77095 and is currently estimated at $264,014, approximately $152 per square foot. 8539 Lake Crystal Dr is a home located in Harris County with nearby schools including Fiest Elementary School, Labay Middle School, and Cypress Falls High School.
Ownership History
Date
Name
Owned For
Owner Type
Purchase Details
Closed on
Feb 24, 1999
Sold by
Rollins Christopher L and Rollins Elizabeth K
Bought by
Mata George and Mata Julie L
Current Estimated Value
Home Financials for this Owner
Home Financials are based on the most recent Mortgage that was taken out on this home.
Original Mortgage
$83,175
Outstanding Balance
$19,839
Interest Rate
6.83%
Estimated Equity
$244,175
Purchase Details
Closed on
Jun 28, 1995
Sold by
Braman Robert J and Braman Mary D
Bought by
Rollins Christopher L and Rollins Elizabeth K
Home Financials for this Owner
Home Financials are based on the most recent Mortgage that was taken out on this home.
Original Mortgage
$79,126
Interest Rate
7.77%
Mortgage Type
FHA
Create a Home Valuation Report for This Property
The Home Valuation Report is an in-depth analysis detailing your home's value as well as a comparison with similar homes in the area
Home Values in the Area
Average Home Value in this Area
Purchase History
| Date | Buyer | Sale Price | Title Company |
|---|---|---|---|
| Mata George | -- | Pacific Title | |
| Rollins Christopher L | -- | Commonwealth Land Title Co |
Source: Public Records
Mortgage History
| Date | Status | Borrower | Loan Amount |
|---|---|---|---|
| Open | Mata George | $83,175 | |
| Previous Owner | Rollins Christopher L | $79,126 |
Source: Public Records
Tax History Compared to Growth
Tax History
| Year | Tax Paid | Tax Assessment Tax Assessment Total Assessment is a certain percentage of the fair market value that is determined by local assessors to be the total taxable value of land and additions on the property. | Land | Improvement |
|---|---|---|---|---|
| 2025 | $2,735 | $249,641 | $70,133 | $179,508 |
| 2024 | $2,735 | $226,399 | $60,985 | $165,414 |
| 2023 | $2,735 | $267,903 | $60,985 | $206,918 |
| 2022 | $4,397 | $226,925 | $48,788 | $178,137 |
| 2021 | $4,212 | $181,414 | $48,788 | $132,626 |
| 2020 | $4,328 | $183,793 | $40,657 | $143,136 |
| 2019 | $4,072 | $181,258 | $33,881 | $147,377 |
| 2018 | $2,160 | $163,951 | $33,881 | $130,070 |
| 2017 | $3,441 | $150,000 | $33,881 | $116,119 |
| 2016 | $3,469 | $154,410 | $33,881 | $120,529 |
| 2015 | $1,423 | $145,000 | $33,881 | $111,119 |
| 2014 | $1,423 | $138,187 | $26,427 | $111,760 |
Source: Public Records
Map
Nearby Homes
- 8526 Greenleaf Lake Dr
- 15634 Haleys Landing Ln
- 15735 Jamie Lee Dr
- 15610 Tarpon Springs Ct
- 15610 Manorford Ct
- 15627 Kentwater Ct
- 15611 Meadow Village Dr
- 15802 Aberdeen Trails Dr
- 15414 Swan Creek Dr
- 8818 Apple Mill Dr
- 15415 Swan Creek Dr
- 9303 Reston Grove Ln
- 15954 Oak Mountain Dr
- 8306 Lake Crystal Dr
- 15362 Meadow Village Dr
- 8526 Hot Springs Dr
- 8550 Sparkling Springs Dr
- 9111 Sunny Ridge Dr
- 8203 Green Devon Dr
- 15339 Glenwood Park Dr
- 8603 Lake Crystal Dr
- 8535 Lake Crystal Dr
- 8602 Greenleaf Lake Dr
- 8531 Lake Crystal Dr
- 8607 Lake Crystal Dr
- 8530 Greenleaf Lake Dr
- 8606 Greenleaf Lake Dr
- 8542 Lake Crystal Dr
- 8538 Lake Crystal Dr
- 8602 Lake Crystal Dr
- 8527 Lake Crystal Dr
- 8611 Lake Crystal Dr
- 8534 Lake Crystal Dr
- 8610 Greenleaf Lake Dr
- 8606 Lake Crystal Dr
- 8522 Greenleaf Lake Dr
- 8610 Lake Crystal Dr
- 8615 Lake Crystal Dr
- 8523 Lake Crystal Dr
- 8614 Greenleaf Lake Dr