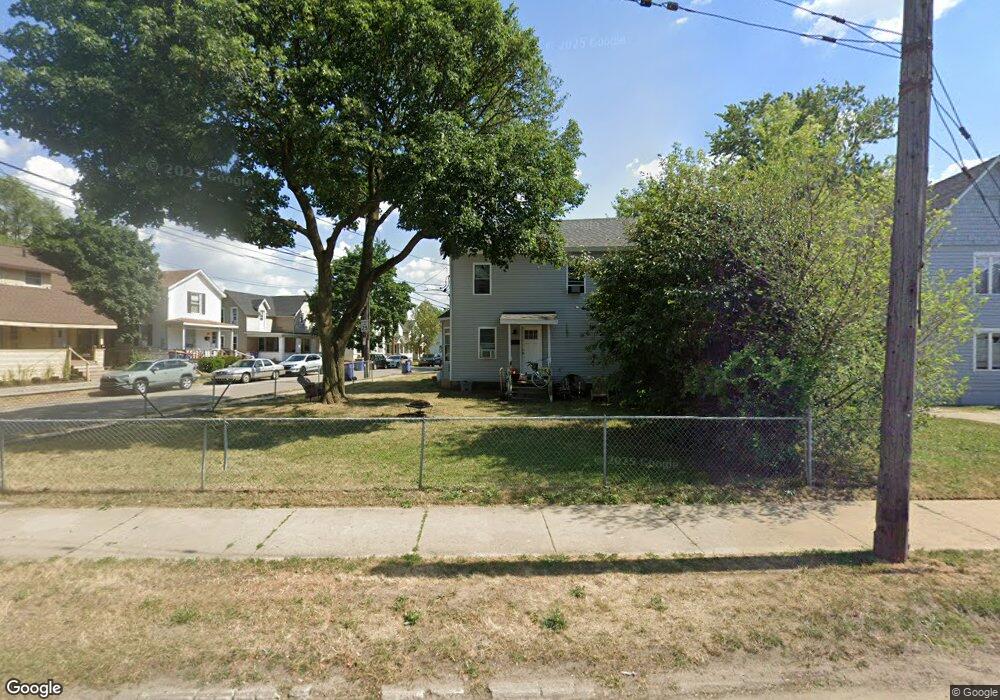
854 Butterworth St SW Grand Rapids, MI 49504
SWAN NeighborhoodEstimated Value: $273,000 - $350,000
2
Beds
1
Bath
1,026
Sq Ft
$300/Sq Ft
Est. Value
About This Home
This home is located at 854 Butterworth St SW, Grand Rapids, MI 49504 and is currently estimated at $307,844, approximately $300 per square foot. 854 Butterworth St SW is a home located in Kent County with nearby schools including Shawmut Hills School, Westwood Middle School, and Union High School.
Ownership History
Date
Name
Owned For
Owner Type
Purchase Details
Closed on
Jan 16, 2020
Sold by
Sieting Afton R
Bought by
616 Investments Llc
Current Estimated Value
Purchase Details
Closed on
Mar 31, 2015
Sold by
Mcclurken Cynthia S
Bought by
Sieting Shirley A
Purchase Details
Closed on
Jan 23, 2012
Sold by
Mcclurken James W and Mcclurken Joanne
Bought by
Mcclurken Cynthia
Purchase Details
Closed on
Jan 22, 2000
Sold by
Mcclurken James W Joanne
Bought by
Mcclurken Cynthia and Sieting Shirley A
Purchase Details
Closed on
Jul 8, 1997
Sold by
Mclkn Mclkn J J and Mclkn J
Bought by
Sieting Mcclurkn C and Sieting Shirley A
Purchase Details
Closed on
May 22, 1997
Sold by
Hnylk Hnylk R R and Hnylk Mclurken J
Bought by
Sieting Shirley A
Purchase Details
Closed on
Sep 16, 1996
Bought by
Sieting Mcclurken J and Sieting Shirley A
Purchase Details
Closed on
Nov 17, 1995
Sold by
Mcclurken Mcclurken J J and Mcclurken Hnyluk
Bought by
Sieting Hnyluk and Sieting Shirley A
Create a Home Valuation Report for This Property
The Home Valuation Report is an in-depth analysis detailing your home's value as well as a comparison with similar homes in the area
Home Values in the Area
Average Home Value in this Area
Purchase History
| Date | Buyer | Sale Price | Title Company |
|---|---|---|---|
| 616 Investments Llc | $96,000 | None Available | |
| Sieting Shirley A | $4,250 | None Available | |
| Mcclurken Cynthia | $29,000 | None Available | |
| Mcclurken Cynthia | $29,000 | -- | |
| Sieting Mcclurkn C | $29,000 | -- | |
| Sieting Shirley A | -- | -- | |
| Sieting Mcclurken J | -- | -- | |
| Sieting Hnyluk | $29,000 | -- |
Source: Public Records
Tax History Compared to Growth
Tax History
| Year | Tax Paid | Tax Assessment Tax Assessment Total Assessment is a certain percentage of the fair market value that is determined by local assessors to be the total taxable value of land and additions on the property. | Land | Improvement |
|---|---|---|---|---|
| 2025 | $5,017 | $155,200 | $0 | $0 |
| 2024 | $5,017 | $133,700 | $0 | $0 |
| 2023 | $4,976 | $118,900 | $0 | $0 |
| 2022 | $4,730 | $99,400 | $0 | $0 |
| 2021 | $4,608 | $88,300 | $0 | $0 |
| 2020 | $1,651 | $65,600 | $0 | $0 |
| 2019 | $1,201 | $52,500 | $0 | $0 |
| 2018 | $1,160 | $42,800 | $0 | $0 |
| 2017 | $1,130 | $36,100 | $0 | $0 |
| 2016 | $1,142 | $32,600 | $0 | $0 |
| 2015 | $1,068 | $32,600 | $0 | $0 |
| 2013 | -- | $29,000 | $0 | $0 |
Source: Public Records
Map
Nearby Homes
- 844 Watson St SW
- 856 Watson St SW
- 205 Lane Ave SW
- 1023 Pulawski St SW
- 1046 Pulawski St SW
- 827 Fulton St W
- 914 Fulton St W
- 823 Fulton St W
- 748 Lake Michigan Dr NW
- 922 Lake Michigan Dr NW
- 1015 California St NW
- 859 Lake Michigan Dr NW
- 258 Richards Ave SW
- 1128 California St NW
- 12 Valley Ave SW
- 205 Lane Ave NW
- 452 Pleasant St SW
- 448 Pleasant St SW
- 444 Pleasant St SW
- 440 Pleasant St SW
- 860 Butterworth St SW
- 308 Indiana Ave SW
- 310 Indiana Ave SW
- 317 Indiana Ave SW
- 864 Butterworth St SW
- 838 Butterworth St SW
- 314 Indiana Ave SW
- 323 Indiana Ave SW
- 870 Butterworth St SW
- 310 Hogadone Ave SW
- 318 Indiana Ave SW
- 327 Indiana Ave SW
- 855 Butterworth St SW
- 849 Butterworth St SW
- 327 Indiana Ave SW
- 316 Hogadone Ave SW
- 859 Butterworth St SW
- 324 Indiana Ave SW
- 900 Butterworth St SW
- 869 Butterworth St SW