Estimated Value: $274,000
Studio
--
Bath
1,026
Sq Ft
$267/Sq Ft
Est. Value
About This Home
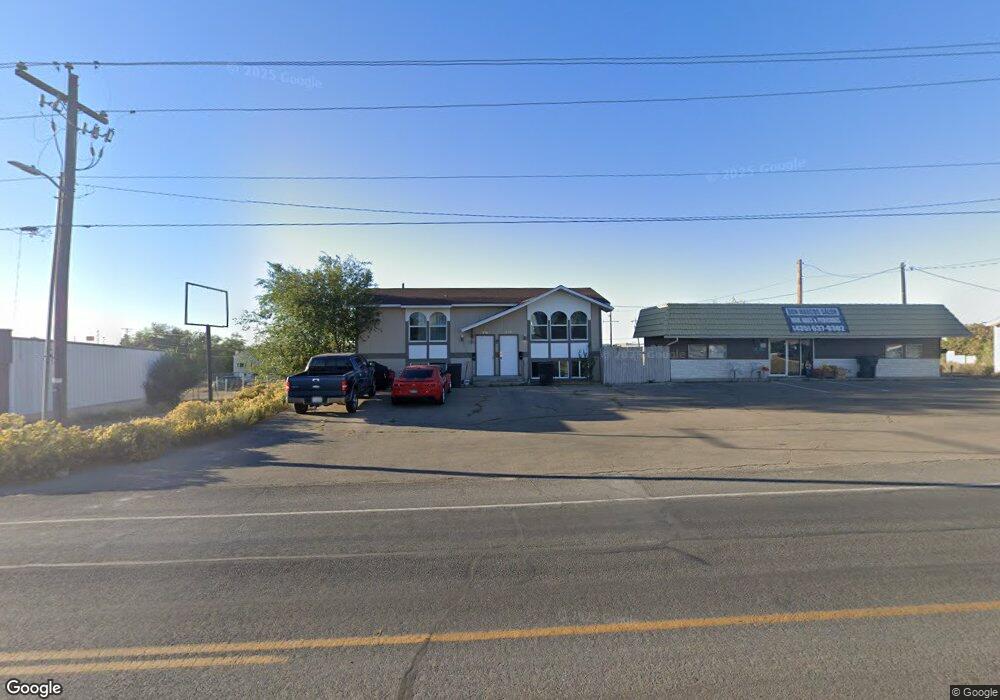
This home is located at 854 E 100 N, Price, UT 84501 and is currently estimated at $274,000, approximately $267 per square foot. 854 E 100 N is a home located in Carbon County with nearby schools including Castle Heights School, Mont Harmon Junior High School, and Carbon High School.
Ownership History
Date
Name
Owned For
Owner Type
Purchase Details
Closed on
Aug 27, 2024
Sold by
Price Properties Group Llc
Bought by
Price Properties Group Llc
Current Estimated Value
Home Financials for this Owner
Home Financials are based on the most recent Mortgage that was taken out on this home.
Original Mortgage
$234,000
Outstanding Balance
$101,353
Interest Rate
6.77%
Mortgage Type
New Conventional
Estimated Equity
$172,647
Purchase Details
Closed on
Mar 28, 2013
Sold by
Tatton Insurance Agency Inc
Bought by
Price Properties Group Llc
Home Financials for this Owner
Home Financials are based on the most recent Mortgage that was taken out on this home.
Original Mortgage
$150,000
Interest Rate
3.49%
Mortgage Type
Unknown
Create a Home Valuation Report for This Property
The Home Valuation Report is an in-depth analysis detailing your home's value as well as a comparison with similar homes in the area
Purchase History
| Date | Buyer | Sale Price | Title Company |
|---|---|---|---|
| Price Properties Group Llc | -- | Professional Title | |
| Price Properties Group Llc | -- | Professional Title | |
| Price Properties Group Llc | $150,000 | None Available |
Source: Public Records
Mortgage History
| Date | Status | Borrower | Loan Amount |
|---|---|---|---|
| Open | Price Properties Group Llc | $234,000 | |
| Closed | Price Properties Group Llc | $234,000 | |
| Previous Owner | Price Properties Group Llc | $150,000 |
Source: Public Records
Tax History
| Year | Tax Paid | Tax Assessment Tax Assessment Total Assessment is a certain percentage of the fair market value that is determined by local assessors to be the total taxable value of land and additions on the property. | Land | Improvement |
|---|---|---|---|---|
| 2025 | $3,653 | $300,644 | $19,989 | $280,655 |
| 2024 | $3,260 | $271,448 | $31,345 | $240,103 |
| 2023 | $2,421 | $215,000 | $25,000 | $190,000 |
| 2022 | $3,071 | $244,601 | $21,160 | $223,441 |
| 2021 | $2,665 | $181,186 | $15,674 | $165,512 |
| 2020 | $2,614 | $162,150 | $0 | $0 |
| 2019 | $2,492 | $162,150 | $0 | $0 |
| 2018 | $2,003 | $132,921 | $0 | $0 |
| 2017 | $1,978 | $132,921 | $0 | $0 |
| 2016 | $1,784 | $132,921 | $0 | $0 |
| 2015 | $1,784 | $132,921 | $0 | $0 |
| 2014 | $1,344 | $100,771 | $0 | $0 |
| 2013 | $1,357 | $100,771 | $0 | $0 |
Source: Public Records
Map
Nearby Homes
- 856 E 100 N
- 838 N Cedarhills Dr
- 838 E 100 N
- 836 E 100 N
- 836 E 100 N
- 894 E 100 N
- 911 E 100 N
- 845 E Main St
- 801 E Main St
- 925 E Main St
- 771 E Main St
- 70 N 700 E
- 40 N 700 E
- 140 N Cedar Hills Dr Unit 2C
- 140 N Cedar Hills Dr Unit 5A
- 140 N Cedar Hills Dr Unit 4B
- 140 N Cedar Hills Dr Unit 4A
- 140 N Cedar Hills Dr Unit 3D
- 140 N Cedar Hills Dr Unit 3C
- 140 N Cedar Hills Dr Unit 3B
Your Personal Tour Guide
Ask me questions while you tour the home.