Estimated Value: $224,000 - $285,000
4
Beds
2
Baths
1,838
Sq Ft
$138/Sq Ft
Est. Value
About This Home
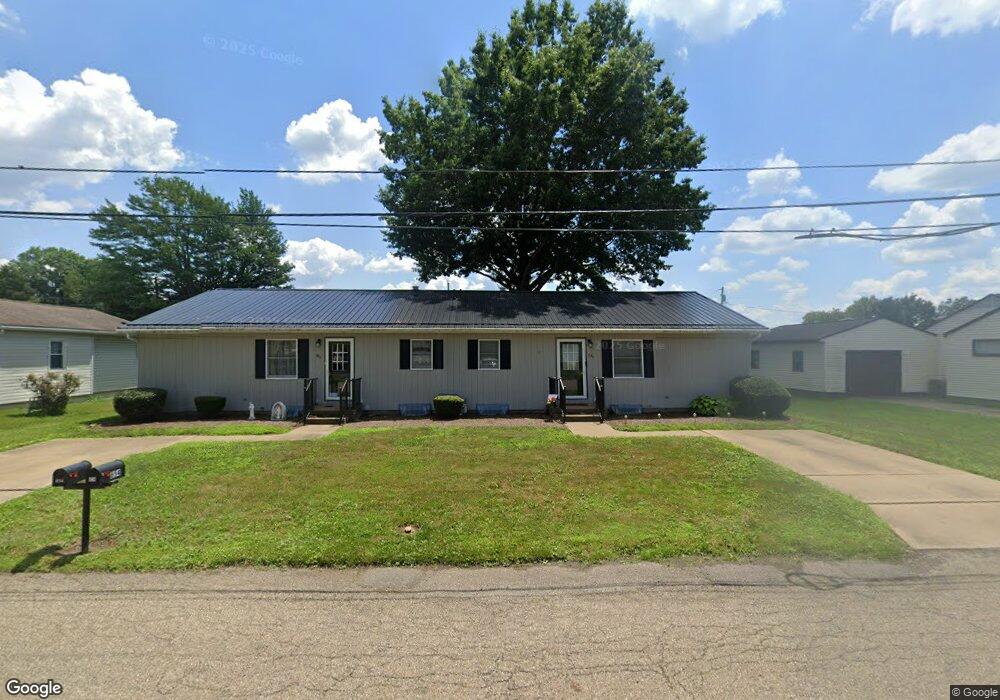
This home is located at 854 N Bellevue Ave, Dover, OH 44622 and is currently estimated at $254,148, approximately $138 per square foot. 854 N Bellevue Ave is a home located in Tuscarawas County with nearby schools including Dover High School, Tuscarawas Central Catholic Elementary School, and Tuscarawas Central Catholic Junior/Senior High School.
Ownership History
Date
Name
Owned For
Owner Type
Purchase Details
Closed on
Oct 9, 2019
Sold by
Mathias Tamara K
Bought by
Legacy Giving Llc
Current Estimated Value
Purchase Details
Closed on
Oct 23, 2007
Sold by
Schilling William T and Schilling Linda S
Bought by
Mathias Tamara K
Home Financials for this Owner
Home Financials are based on the most recent Mortgage that was taken out on this home.
Original Mortgage
$126,300
Interest Rate
6.33%
Mortgage Type
Commercial
Purchase Details
Closed on
Aug 31, 1994
Sold by
Est Lillian M Valentine
Bought by
Schilling William T and Schilling Linda S
Home Financials for this Owner
Home Financials are based on the most recent Mortgage that was taken out on this home.
Original Mortgage
$68,000
Interest Rate
8.12%
Mortgage Type
New Conventional
Purchase Details
Closed on
Mar 21, 1990
Sold by
Valentine Robert E and Valentine Lillian M
Bought by
Valentine Lillian M
Create a Home Valuation Report for This Property
The Home Valuation Report is an in-depth analysis detailing your home's value as well as a comparison with similar homes in the area
Home Values in the Area
Average Home Value in this Area
Purchase History
| Date | Buyer | Sale Price | Title Company |
|---|---|---|---|
| Legacy Giving Llc | -- | None Available | |
| Mathias Tamara K | $157,900 | None Available | |
| Schilling William T | $85,000 | -- | |
| Valentine Lillian M | -- | -- |
Source: Public Records
Mortgage History
| Date | Status | Borrower | Loan Amount |
|---|---|---|---|
| Previous Owner | Mathias Tamara K | $126,300 | |
| Previous Owner | Schilling William T | $68,000 |
Source: Public Records
Tax History Compared to Growth
Tax History
| Year | Tax Paid | Tax Assessment Tax Assessment Total Assessment is a certain percentage of the fair market value that is determined by local assessors to be the total taxable value of land and additions on the property. | Land | Improvement |
|---|---|---|---|---|
| 2024 | $3,054 | $69,670 | $14,670 | $55,000 |
| 2023 | $3,054 | $199,040 | $41,900 | $157,140 |
| 2022 | $3,084 | $69,664 | $14,665 | $54,999 |
| 2021 | $2,798 | $59,361 | $12,310 | $47,051 |
| 2020 | $2,798 | $59,361 | $12,310 | $47,051 |
| 2019 | $2,818 | $59,361 | $12,310 | $47,051 |
| 2018 | $2,515 | $50,090 | $10,390 | $39,700 |
| 2017 | $2,515 | $50,090 | $10,390 | $39,700 |
| 2016 | $2,513 | $50,090 | $10,390 | $39,700 |
| 2014 | $2,259 | $48,650 | $11,000 | $37,650 |
| 2013 | $2,282 | $48,650 | $11,000 | $37,650 |
Source: Public Records
Map
Nearby Homes
- 334 Monroe St
- 605 Bond St
- 1331 Kelly St NW
- 221 S James St
- 414 E Wills Ave
- 245 E Wills Ave
- 2902 Downeys Hill Dr NE
- 214 Liberty St
- 1319 Terrace Rd NW
- 1003 Kaderly St NW
- 3031 Downeys Hill Dr NE
- 415 Bowers Ave NW
- 919 Oak St NW
- 825 Zella Ave NW
- 1023 Prospect Ave NW
- 644 Orchard Ave NW
- 725 Kaderly St NW
- 671 Orchard Ave NW
- 329 Lloyd St
- 633 4th St NW
- 864 N Bellevue Ave
- 850 N Bellevue Ave
- 866 N Bellevue Ave
- 870 N Bellevue Ave
- 840 N Bellevue Ave Unit B
- 874 N Bellevue Ave
- 857 N Bellevue Ave
- 863 N Bellevue Ave
- 878 Terrace St
- 851 N Bellevue Ave Unit 2
- 878 N Bellevue Ave
- 871 N Bellevue Ave
- 841 N Bellevue Ave
- 875 N Bellevue Ave
- 833 Boulevard St
- 837 N Bellevue Ave
- 831 N Bellevue Ave
- 900 Clubview Dr
- 902 N Bellevue Ave
- 827 N Bellevue Ave