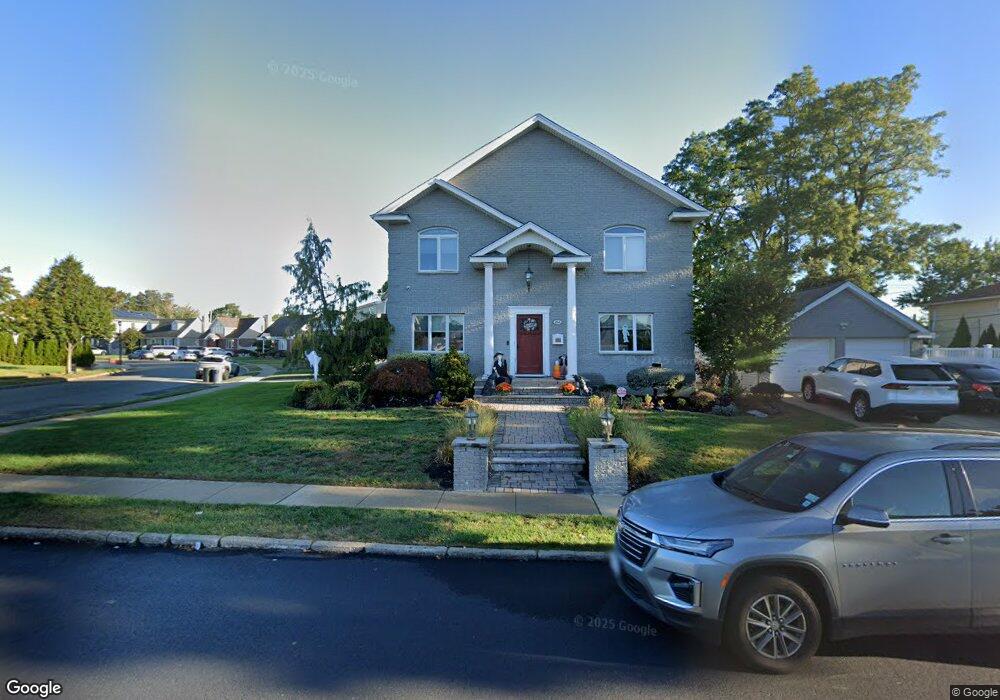
854 Oaks Dr Franklin Square, NY 11010
Estimated Value: $874,762 - $967,000
Studio
2
Baths
1,768
Sq Ft
$521/Sq Ft
Est. Value
About This Home
This home is located at 854 Oaks Dr, Franklin Square, NY 11010 and is currently estimated at $920,881, approximately $520 per square foot. 854 Oaks Dr is a home located in Nassau County with nearby schools including Hebrew Academy of Nassau County (HANC).
Ownership History
Date
Name
Owned For
Owner Type
Purchase Details
Closed on
Mar 14, 2019
Sold by
Stambolis Elias and Lattanzio Diana
Bought by
Lattanzio Diana
Current Estimated Value
Home Financials for this Owner
Home Financials are based on the most recent Mortgage that was taken out on this home.
Original Mortgage
$92,931
Interest Rate
3.55%
Mortgage Type
New Conventional
Purchase Details
Closed on
Oct 20, 2009
Sold by
Stambolis Elias and Lattanzio Diana
Bought by
Lattanzio Diana and Stambolis Elias
Purchase Details
Closed on
Apr 21, 2006
Sold by
Stambolis Elias
Purchase Details
Closed on
Oct 4, 2004
Sold by
Kuna Christine
Bought by
Stambolis Elias
Purchase Details
Closed on
Mar 6, 1996
Sold by
Doyle David
Bought by
Kuna Christine and Kuna James
Home Financials for this Owner
Home Financials are based on the most recent Mortgage that was taken out on this home.
Original Mortgage
$149,000
Interest Rate
7%
Create a Home Valuation Report for This Property
The Home Valuation Report is an in-depth analysis detailing your home's value as well as a comparison with similar homes in the area
Home Values in the Area
Average Home Value in this Area
Purchase History
| Date | Buyer | Sale Price | Title Company |
|---|---|---|---|
| Lattanzio Diana | -- | None Available | |
| Lattanzio Diana | -- | -- | |
| -- | -- | -- | |
| Stambolis Elias | $492,000 | -- | |
| Kuna Christine | $166,000 | -- |
Source: Public Records
Mortgage History
| Date | Status | Borrower | Loan Amount |
|---|---|---|---|
| Previous Owner | Lattanzio Diana | $92,931 | |
| Previous Owner | Kuna Christine | $149,000 |
Source: Public Records
Tax History
| Year | Tax Paid | Tax Assessment Tax Assessment Total Assessment is a certain percentage of the fair market value that is determined by local assessors to be the total taxable value of land and additions on the property. | Land | Improvement |
|---|---|---|---|---|
| 2025 | $12,390 | $597 | $297 | $300 |
| 2024 | $5,071 | $616 | $307 | $309 |
| 2023 | $10,883 | $633 | $315 | $318 |
| 2022 | $10,883 | $633 | $315 | $318 |
| 2021 | $12,577 | $614 | $305 | $309 |
| 2020 | $8,047 | $646 | $412 | $234 |
| 2019 | $8,985 | $693 | $414 | $279 |
| 2018 | $9,154 | $739 | $0 | $0 |
| 2017 | $5,495 | $785 | $418 | $367 |
| 2016 | $9,468 | $831 | $399 | $432 |
| 2015 | $4,147 | $877 | $421 | $456 |
| 2014 | $4,147 | $877 | $421 | $456 |
| 2013 | $4,061 | $920 | $442 | $478 |
Source: Public Records
Map
Nearby Homes
- 850 First Ave
- 912 Oaks Dr
- 911 First Ave
- 562 Bernice Rd
- 597 Seminole Rd
- 660 Hewlett St
- 1053 Lorraine Dr
- 1024 Oaks Dr
- 1007 Third Ave
- 708 Anderson Ave
- 738 Sprague Ave
- 1020 Polk Ave
- 1035 Glen Dr
- 242 James St
- 280 Franklin Ave Unit 11
- 340 Doris Ave
- 249 Grange St
- 984 Shelburne Dr
- 807 Cypress Dr
- 1096 Shelburne Dr
Your Personal Tour Guide
Ask me questions while you tour the home.