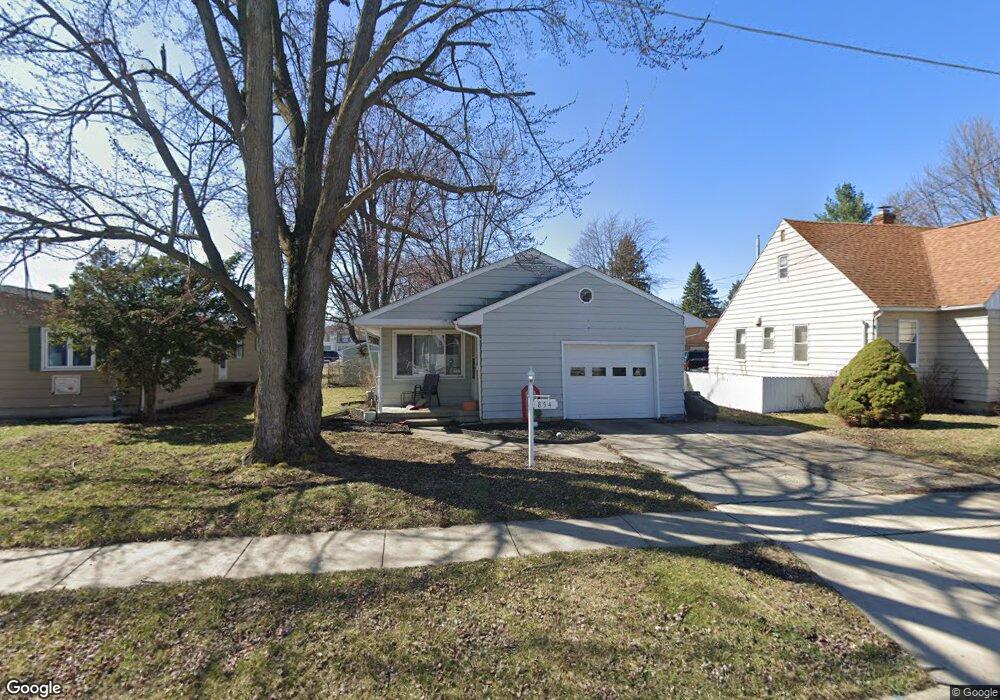
854 Wilson St Findlay, OH 45840
Estimated Value: $142,000 - $152,000
2
Beds
1
Bath
945
Sq Ft
$155/Sq Ft
Est. Value
About This Home
This home is located at 854 Wilson St, Findlay, OH 45840 and is currently estimated at $146,825, approximately $155 per square foot. 854 Wilson St is a home located in Hancock County with nearby schools including Whittier Elementary School, Wilson Vance Elementary School, and Donnell Middle School.
Ownership History
Date
Name
Owned For
Owner Type
Purchase Details
Closed on
Sep 7, 2012
Sold by
Saltz John D
Bought by
Saltz Leann M
Current Estimated Value
Purchase Details
Closed on
Nov 14, 2000
Sold by
Est Dorothy R Tong
Bought by
Saltz Leann M and Saltz John D
Home Financials for this Owner
Home Financials are based on the most recent Mortgage that was taken out on this home.
Original Mortgage
$68,422
Outstanding Balance
$25,266
Interest Rate
7.91%
Mortgage Type
FHA
Estimated Equity
$121,559
Purchase Details
Closed on
Jun 1, 1998
Sold by
Thomas Douglas
Bought by
Tong Dorothy
Home Financials for this Owner
Home Financials are based on the most recent Mortgage that was taken out on this home.
Original Mortgage
$44,000
Interest Rate
7.27%
Mortgage Type
New Conventional
Purchase Details
Closed on
May 10, 1988
Bought by
Thomas Douglas P
Purchase Details
Closed on
Jan 12, 1982
Bought by
Lee Michael E
Create a Home Valuation Report for This Property
The Home Valuation Report is an in-depth analysis detailing your home's value as well as a comparison with similar homes in the area
Home Values in the Area
Average Home Value in this Area
Purchase History
| Date | Buyer | Sale Price | Title Company |
|---|---|---|---|
| Saltz Leann M | -- | Attorney | |
| Saltz Leann M | $68,500 | -- | |
| Tong Dorothy | $58,000 | -- | |
| Thomas Douglas P | $39,000 | -- | |
| Lee Michael E | -- | -- |
Source: Public Records
Mortgage History
| Date | Status | Borrower | Loan Amount |
|---|---|---|---|
| Open | Saltz Leann M | $68,422 | |
| Previous Owner | Tong Dorothy | $44,000 |
Source: Public Records
Tax History
| Year | Tax Paid | Tax Assessment Tax Assessment Total Assessment is a certain percentage of the fair market value that is determined by local assessors to be the total taxable value of land and additions on the property. | Land | Improvement |
|---|---|---|---|---|
| 2024 | $1,221 | $34,370 | $4,850 | $29,520 |
| 2023 | $1,223 | $34,370 | $4,850 | $29,520 |
| 2022 | $1,219 | $34,370 | $4,850 | $29,520 |
| 2021 | $1,081 | $26,550 | $4,850 | $21,700 |
| 2020 | $1,081 | $26,550 | $4,850 | $21,700 |
| 2019 | $1,059 | $26,550 | $4,850 | $21,700 |
| 2018 | $919 | $21,110 | $4,410 | $16,700 |
| 2017 | $459 | $21,110 | $4,410 | $16,700 |
| 2016 | $915 | $21,110 | $4,410 | $16,700 |
| 2015 | $857 | $19,600 | $4,410 | $15,190 |
| 2014 | $857 | $19,600 | $4,410 | $15,190 |
| 2012 | $853 | $19,300 | $4,410 | $14,890 |
Source: Public Records
Map
Nearby Homes
- 829 Maple Ave
- 15591 Canadian Way
- 15586 Canadian Way
- 15615 Canadian Way
- 216 1st St
- 865 S Main St
- 731 5th St
- 206 Greenlawn Ave
- 1037 Fishlock Ave
- 1100 Stall Dr
- 123 Glendale Ave
- 1001 Decker Ave
- 1200 1st St
- 309 Huron Rd
- 523 Center St
- 1304 Douglas Pkwy
- 412 Lima Ave
- 416 1/2 Lima Ave
- 845 Hurd Ave
- 0 Blanchard Ave
- 850 Wilson St
- 858 Wilson St
- 832 Wilson St
- 0 Bennett St Unit H113623
- 830 Wilson St
- 841 S Blanchard St
- 849 Wilson St
- 922 Blanchard Ave
- 839 S Blanchard St
- 833 S Blanchard St
- 853 Wilson St
- 855 Wilson St
- 857 Wilson St
- 833 Wilson St
- 834 Blanchard Ave
- 926 Blanchard Ave
- 861 Wilson St
- 831 Wilson St
- 818 Wilson St
- 827 S Blanchard St
Your Personal Tour Guide
Ask me questions while you tour the home.