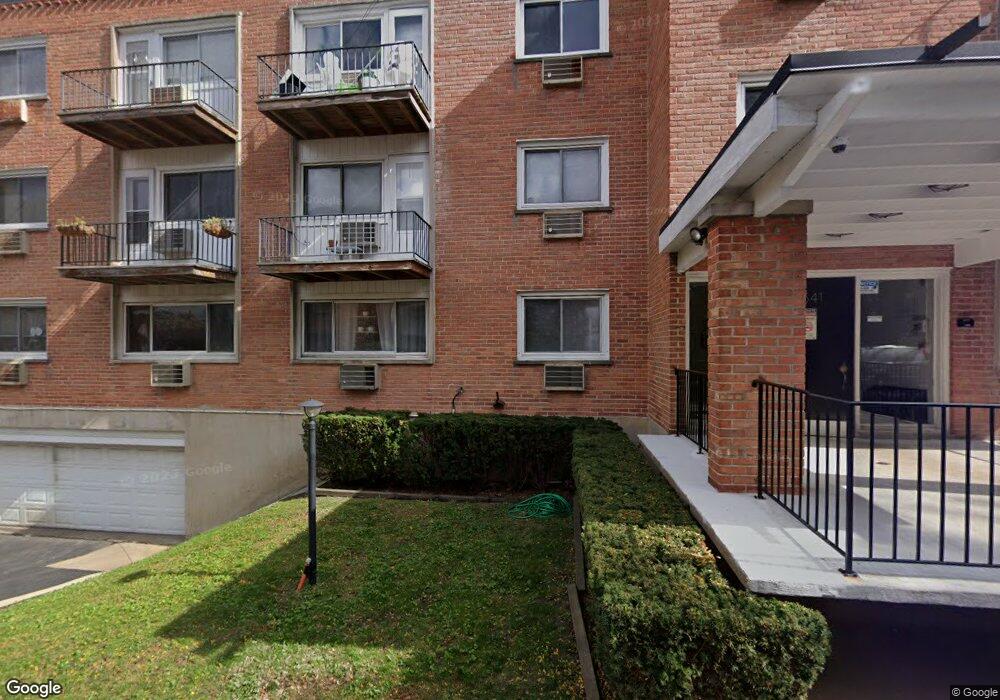
8541 Lotus Ave Unit 716 Skokie, IL 60077
Southwest Skokie NeighborhoodEstimated Value: $112,000 - $134,000
1
Bed
1
Bath
44,739
Sq Ft
$3/Sq Ft
Est. Value
About This Home
This home is located at 8541 Lotus Ave Unit 716, Skokie, IL 60077 and is currently estimated at $125,995, approximately $2 per square foot. 8541 Lotus Ave Unit 716 is a home located in Cook County with nearby schools including Madison Elementary School, Thomas Edison Elementary School, and Lincoln Junior High School.
Ownership History
Date
Name
Owned For
Owner Type
Purchase Details
Closed on
Nov 18, 2010
Sold by
Rossi Blanca F
Bought by
Yaqoob Arshad
Current Estimated Value
Home Financials for this Owner
Home Financials are based on the most recent Mortgage that was taken out on this home.
Original Mortgage
$44,800
Interest Rate
5.04%
Mortgage Type
New Conventional
Purchase Details
Closed on
Apr 27, 2005
Sold by
Adamopoulos Sophia and Papadopoulos Sophia
Bought by
Rossi Blanca F
Home Financials for this Owner
Home Financials are based on the most recent Mortgage that was taken out on this home.
Original Mortgage
$79,300
Interest Rate
6.05%
Mortgage Type
Fannie Mae Freddie Mac
Purchase Details
Closed on
Jan 6, 1997
Sold by
Fogel Clara and Janus Zelda
Bought by
Papadopoulos Sophia
Purchase Details
Closed on
Dec 2, 1994
Sold by
Arif Suhail A and Arif Diana
Bought by
Fogel Clara and Janus Zelda
Create a Home Valuation Report for This Property
The Home Valuation Report is an in-depth analysis detailing your home's value as well as a comparison with similar homes in the area
Home Values in the Area
Average Home Value in this Area
Purchase History
| Date | Buyer | Sale Price | Title Company |
|---|---|---|---|
| Yaqoob Arshad | $56,000 | Chicago Title Insurance Co | |
| Rossi Blanca F | $130,000 | Ticor Title Insurance Compan | |
| Papadopoulos Sophia | $57,500 | First American Title | |
| Fogel Clara | $62,000 | -- |
Source: Public Records
Mortgage History
| Date | Status | Borrower | Loan Amount |
|---|---|---|---|
| Previous Owner | Yaqoob Arshad | $44,800 | |
| Previous Owner | Rossi Blanca F | $79,300 |
Source: Public Records
Tax History Compared to Growth
Tax History
| Year | Tax Paid | Tax Assessment Tax Assessment Total Assessment is a certain percentage of the fair market value that is determined by local assessors to be the total taxable value of land and additions on the property. | Land | Improvement |
|---|---|---|---|---|
| 2024 | $2,526 | $8,100 | $1,005 | $7,095 |
| 2023 | $2,525 | $8,100 | $1,005 | $7,095 |
| 2022 | $2,525 | $8,100 | $1,005 | $7,095 |
| 2021 | $2,436 | $6,727 | $618 | $6,109 |
| 2020 | $2,419 | $6,727 | $618 | $6,109 |
| 2019 | $2,897 | $9,011 | $618 | $8,393 |
| 2018 | $2,240 | $6,256 | $560 | $5,696 |
| 2017 | $2,250 | $6,256 | $560 | $5,696 |
| 2016 | $2,120 | $6,256 | $560 | $5,696 |
| 2015 | $1,649 | $4,617 | $483 | $4,134 |
| 2014 | $1,612 | $4,617 | $483 | $4,134 |
| 2013 | $1,938 | $5,480 | $483 | $4,997 |
Source: Public Records
Map
Nearby Homes
- 8541 Lotus Ave Unit 914
- 5500 Lincoln Ave Unit 319E
- 5500 Lincoln Ave Unit 109W
- 5500 Lincoln Ave Unit 407W
- 5500 Lincoln Ave Unit 116E
- 5510 Lincoln Ave Unit B301
- 5506 Lincoln Ave Unit A114
- 5510 Lincoln Ave Unit B101
- 5406 Lincoln Ave Unit 3F
- 5501 Lincoln Ave Unit 203
- 8464 Gross Point Rd
- 8655 Harms Rd
- 8461 Gross Point Rd
- 8708 Central Ave
- 5309 Crain St
- 8306 Central Ave
- 8605 Laramie Ave
- 8717 Gross Point Rd
- 5126 Elm St
- 5459 Suffield Ct
- 8541 Lotus Ave Unit 917
- 8521 Lotus Ave Unit 708
- 8521 Lotus Ave Unit 805
- 8541 Lotus Ave Unit 905
- 8541 Lotus Ave Unit 910
- 8541 Lotus Ave Unit 811
- 8541 Lotus Ave Unit 815
- 8521 Lotus Ave Unit 702
- 8541 Lotus Ave Unit 709
- 8541 Lotus Ave Unit 718
- 8541 Lotus Ave Unit 902
- 8521 Lotus Ave Unit 802
- 8541 Lotus Ave Unit 812
- 8541 Lotus Ave Unit 810
- 8541 Lotus Ave Unit 710
- 8521 Lotus Ave Unit 704
- 8541 Lotus Ave Unit 904
- 8541 Lotus Ave Unit 717
- 8521 Lotus Ave Unit 804
- 8521 Lotus Ave Unit 808