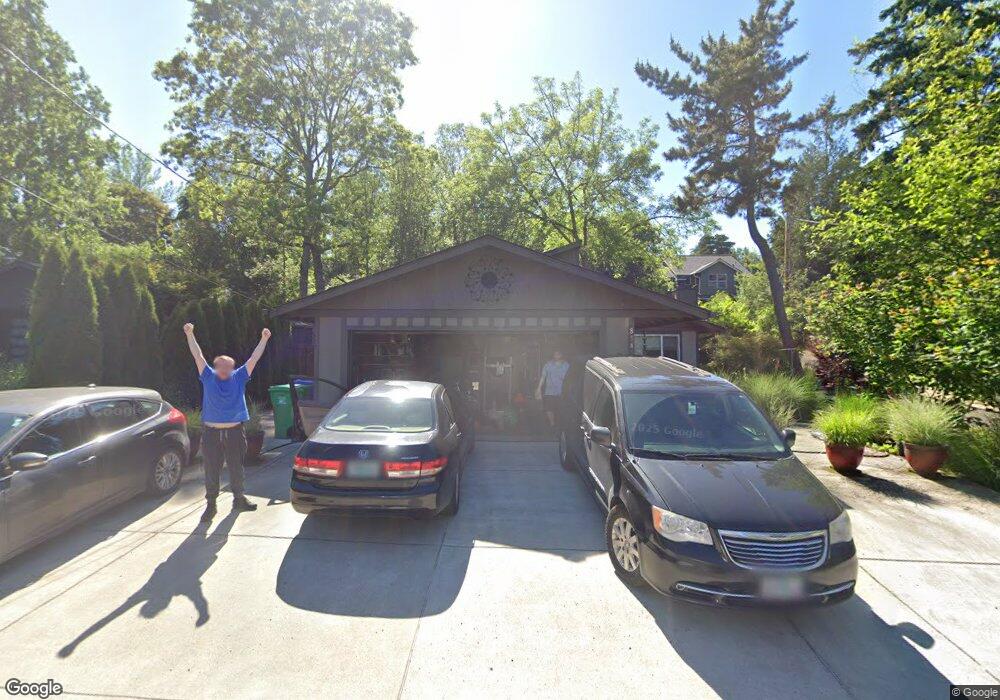
8541 SW 37th Ave Portland, OR 97219
Multnomah NeighborhoodEstimated Value: $524,000 - $628,000
4
Beds
2
Baths
1,520
Sq Ft
$387/Sq Ft
Est. Value
About This Home
This home is located at 8541 SW 37th Ave, Portland, OR 97219 and is currently estimated at $587,646, approximately $386 per square foot. 8541 SW 37th Ave is a home located in Multnomah County with nearby schools including Maplewood Elementary School, Jackson Middle School, and Ida B. Wells-Barnett High School.
Ownership History
Date
Name
Owned For
Owner Type
Purchase Details
Closed on
Oct 20, 2015
Sold by
Price Nena
Bought by
Clark Jason A and Clark Angela R
Current Estimated Value
Purchase Details
Closed on
Jul 6, 2015
Sold by
Goodman Anne Haiqi
Bought by
Price Nena and Alice E Goodman Goodman
Purchase Details
Closed on
Sep 22, 2005
Sold by
Hilliard Donnis C
Bought by
Goodman Alice E
Home Financials for this Owner
Home Financials are based on the most recent Mortgage that was taken out on this home.
Original Mortgage
$125,000
Interest Rate
7.6%
Mortgage Type
Fannie Mae Freddie Mac
Purchase Details
Closed on
Jul 13, 2004
Sold by
Hilliard Bruce A
Bought by
Hilliard Dennis C
Home Financials for this Owner
Home Financials are based on the most recent Mortgage that was taken out on this home.
Original Mortgage
$157,000
Interest Rate
5.62%
Mortgage Type
New Conventional
Create a Home Valuation Report for This Property
The Home Valuation Report is an in-depth analysis detailing your home's value as well as a comparison with similar homes in the area
Home Values in the Area
Average Home Value in this Area
Purchase History
| Date | Buyer | Sale Price | Title Company |
|---|---|---|---|
| Clark Jason A | $257,000 | Old Republic Title | |
| Price Nena | -- | Old Republic Title | |
| Goodman Alice E | $234,900 | Chicago Title Insurance Comp | |
| Hilliard Dennis C | -- | Fidelity Natl Title Co Of Or |
Source: Public Records
Mortgage History
| Date | Status | Borrower | Loan Amount |
|---|---|---|---|
| Previous Owner | Goodman Alice E | $125,000 | |
| Previous Owner | Hilliard Dennis C | $157,000 |
Source: Public Records
Tax History Compared to Growth
Tax History
| Year | Tax Paid | Tax Assessment Tax Assessment Total Assessment is a certain percentage of the fair market value that is determined by local assessors to be the total taxable value of land and additions on the property. | Land | Improvement |
|---|---|---|---|---|
| 2025 | $7,787 | $289,280 | -- | -- |
| 2024 | $7,507 | $280,860 | -- | -- |
| 2023 | $7,219 | $272,680 | $0 | $0 |
| 2022 | $7,063 | $264,740 | $0 | $0 |
| 2021 | $6,943 | $257,030 | $0 | $0 |
| 2020 | $6,369 | $249,550 | $0 | $0 |
| 2019 | $6,135 | $242,290 | $0 | $0 |
| 2018 | $5,955 | $235,240 | $0 | $0 |
| 2017 | $5,707 | $228,390 | $0 | $0 |
| 2016 | $5,223 | $221,740 | $0 | $0 |
| 2015 | $5,086 | $215,290 | $0 | $0 |
| 2014 | $4,666 | $209,020 | $0 | $0 |
Source: Public Records
Map
Nearby Homes
- 8922 SW Capitol Hwy
- 8342 SW 41st Ave
- 3139 SW Freeman St
- 7739 SW 42nd Ave Unit 16
- 7737 SW 42nd Ave Unit 17
- 7931 SW 40th Ave Unit H
- 3925 SW Multnomah Blvd Unit 201
- 8023 SW 31st Ave
- 8102 SW 31st Ave Unit 8122
- 7831 SW 34th Ave Unit 7837
- 8015 SW 45th Ave
- 8116 SW 46th Ave
- 8274 SW 47th Ave
- 2924 SW Multnomah Blvd
- 7872 SW 31st Ave Unit 11
- 9606 SW 41st Ave
- 7733 SW 42nd Ave
- 8005 SW 46th Ave
- 9647 SW Capitol Hwy
- 7868 SW 30th Ave
- 8605 SW 37th Ave
- 8537 SW 37th Ave
- 3669 SW Spring Garden Ct
- 8619 SW 37th Ave
- 3655 SW Spring Garden Ct
- 3685 SW Spring Garden Ct
- 0 SW Spring Garden Ct
- 3652 SW Spring Garden St
- 3811 SW Dolph Ct
- 3637 SW Spring Garden Ct
- 3707 SW Dolph Ct
- 3646 SW Spring Garden St
- 3818 SW Spring Garden St
- 3704 SW Spring Garden St
- 3823 SW Dolph Ct
- 3674 SW Spring Garden Ct
- 3652 SW Spring Garden Ct
- 3665 SW Dolph Ct
- 3825 SW Dolph Ct
- 3912 SW Freeman St