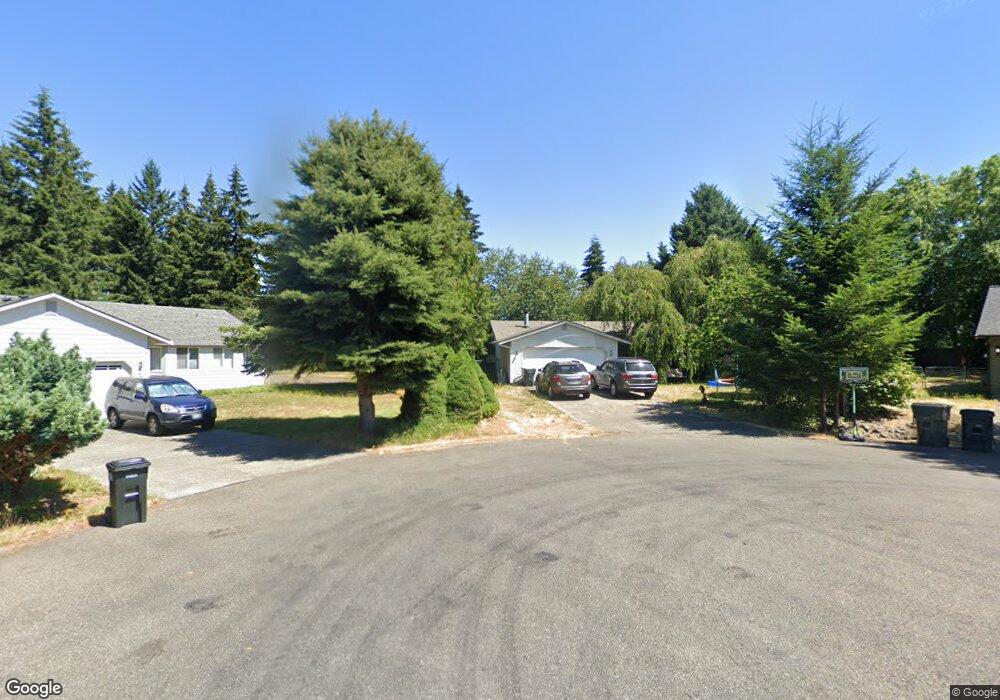
8542 Glenlea Ct SE Yelm, WA 98597
North Yelm NeighborhoodEstimated Value: $428,000 - $469,000
3
Beds
2
Baths
1,354
Sq Ft
$326/Sq Ft
Est. Value
About This Home
This home is located at 8542 Glenlea Ct SE, Yelm, WA 98597 and is currently estimated at $441,234, approximately $325 per square foot. 8542 Glenlea Ct SE is a home located in Thurston County with nearby schools including Fort Stevens Elementary School, Yelm Middle School, and Yelm High School.
Ownership History
Date
Name
Owned For
Owner Type
Purchase Details
Closed on
Feb 13, 2007
Sold by
Luchino Michael F
Bought by
Luchino Shari L
Current Estimated Value
Purchase Details
Closed on
Jun 14, 2006
Sold by
Luchino Michael F
Bought by
Luchino Shari L
Home Financials for this Owner
Home Financials are based on the most recent Mortgage that was taken out on this home.
Original Mortgage
$100,700
Outstanding Balance
$59,137
Interest Rate
6.55%
Mortgage Type
Fannie Mae Freddie Mac
Estimated Equity
$382,097
Purchase Details
Closed on
Nov 16, 2001
Sold by
Luchino Shari L
Bought by
Luchino Michael F and Luchino Shari L
Home Financials for this Owner
Home Financials are based on the most recent Mortgage that was taken out on this home.
Original Mortgage
$100,000
Interest Rate
6.57%
Purchase Details
Closed on
Aug 29, 1995
Sold by
Curtis Daniel T
Bought by
Curtis Shari L
Create a Home Valuation Report for This Property
The Home Valuation Report is an in-depth analysis detailing your home's value as well as a comparison with similar homes in the area
Home Values in the Area
Average Home Value in this Area
Purchase History
| Date | Buyer | Sale Price | Title Company |
|---|---|---|---|
| Luchino Shari L | -- | None Available | |
| Luchino Shari L | -- | Chicago Title Company | |
| Luchino Michael F | -- | Stewart Title Company | |
| Curtis Shari L | -- | -- |
Source: Public Records
Mortgage History
| Date | Status | Borrower | Loan Amount |
|---|---|---|---|
| Open | Luchino Shari L | $100,700 | |
| Previous Owner | Luchino Michael F | $100,000 |
Source: Public Records
Tax History Compared to Growth
Tax History
| Year | Tax Paid | Tax Assessment Tax Assessment Total Assessment is a certain percentage of the fair market value that is determined by local assessors to be the total taxable value of land and additions on the property. | Land | Improvement |
|---|---|---|---|---|
| 2024 | $3,568 | $378,800 | $150,600 | $228,200 |
| 2023 | $3,568 | $369,100 | $133,900 | $235,200 |
| 2022 | $3,281 | $352,800 | $93,500 | $259,300 |
| 2021 | $3,095 | $299,300 | $107,100 | $192,200 |
| 2020 | $2,907 | $246,300 | $82,200 | $164,100 |
| 2019 | $2,194 | $225,000 | $64,500 | $160,500 |
| 2018 | $2,383 | $174,900 | $31,400 | $143,500 |
| 2017 | $2,089 | $157,650 | $30,450 | $127,200 |
| 2016 | $2,029 | $152,350 | $41,850 | $110,500 |
| 2014 | -- | $143,800 | $40,200 | $103,600 |
Source: Public Records
Map
Nearby Homes
- 8522 McNiece Loop SE
- 8702 Sweet Clover Dr SE
- 8517 Pepperidge Ln SE
- 8915 Wilkensen Rd SE Unit 3
- 8439 Pepperidge Ln SE
- 8413 Pepperidge Ln SE
- 8844 Thuja Ave SE
- 16420 Canal Ct SE
- 16414 Canal Ct SE
- 8747 Mariana Ct SE
- 8918 Mulberry Ct SE
- 16838 Cornus Ct SE
- 9047 Pepperidge Ln SE
- 9149 Thea Rose Dr SE
- 17042 Arborvitae Ct SE
- 9206 Carys St SE
- 17033 Wisteria Ct SE
- 15730 91st Way SE
- 15832 Woodland Ct SE Unit 15
- 15826 Woodland Ct SE Unit 14
- 8548 Glenlea Ct SE
- 8539 Glenlea Ct SE
- 8543 Sweet Clover Dr SE
- 8545 Sweet Clover Dr SE
- 16335 84th Ct SE
- 8537 Sweet Clover Dr SE
- 8604 Glenlea Ct SE
- 16404 84th Ct SE
- 8549 Glenlea Ct SE
- 8618 Glenlea Ct SE
- 8540 Sweet Clover Dr SE
- 8609 Glenlea Ct SE
- 16400 84th Ct SE
- 8514 McNiece Loop SE
- 16630 84th Ct SE
- 8544 Sweet Clover Dr SE
- 8610 Sweet Clover Dr SE
- 8510 McNiece Loop SE
- 8546 Sweet Clover Dr SE