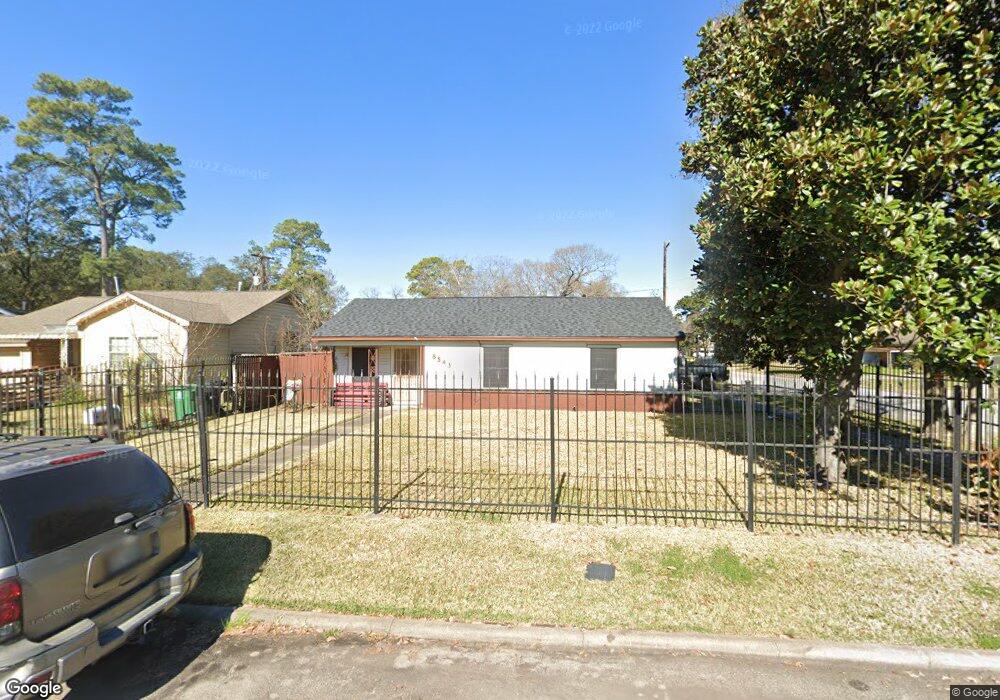
8543 Biloxi St Houston, TX 77017
Park Place NeighborhoodEstimated Value: $201,434 - $232,000
2
Beds
1
Bath
1,414
Sq Ft
$151/Sq Ft
Est. Value
About This Home
This home is located at 8543 Biloxi St, Houston, TX 77017 and is currently estimated at $213,859, approximately $151 per square foot. 8543 Biloxi St is a home located in Harris County with nearby schools including Sanchez Elementary School, Chavez High School, and YES Prep - East End.
Ownership History
Date
Name
Owned For
Owner Type
Purchase Details
Closed on
Jul 23, 2011
Sold by
Gandarilla Jose A and Gandarilla Reyna
Bought by
Gaspar Fernando
Current Estimated Value
Home Financials for this Owner
Home Financials are based on the most recent Mortgage that was taken out on this home.
Original Mortgage
$83,460
Interest Rate
3.87%
Mortgage Type
FHA
Purchase Details
Closed on
Nov 30, 1998
Sold by
Puga Roberto Silva and Cantu Nancy E
Bought by
Gandarilla Jose A and Gandarilla Reyna S
Home Financials for this Owner
Home Financials are based on the most recent Mortgage that was taken out on this home.
Original Mortgage
$55,419
Interest Rate
6.69%
Mortgage Type
FHA
Purchase Details
Closed on
Jan 1, 1994
Sold by
Diconi Charles Anthony and Diconi Mary Edeanor
Bought by
Puga Roberto Silva and Cantu Nancy E
Home Financials for this Owner
Home Financials are based on the most recent Mortgage that was taken out on this home.
Original Mortgage
$39,000
Interest Rate
7.25%
Mortgage Type
Seller Take Back
Create a Home Valuation Report for This Property
The Home Valuation Report is an in-depth analysis detailing your home's value as well as a comparison with similar homes in the area
Home Values in the Area
Average Home Value in this Area
Purchase History
| Date | Buyer | Sale Price | Title Company |
|---|---|---|---|
| Gaspar Fernando | $83,460 | None Available | |
| Gandarilla Jose A | -- | Texas American Title Company | |
| Puga Roberto Silva | -- | -- |
Source: Public Records
Mortgage History
| Date | Status | Borrower | Loan Amount |
|---|---|---|---|
| Previous Owner | Gaspar Fernando | $83,460 | |
| Previous Owner | Gandarilla Jose A | $55,419 | |
| Previous Owner | Puga Roberto Silva | $39,000 |
Source: Public Records
Tax History Compared to Growth
Tax History
| Year | Tax Paid | Tax Assessment Tax Assessment Total Assessment is a certain percentage of the fair market value that is determined by local assessors to be the total taxable value of land and additions on the property. | Land | Improvement |
|---|---|---|---|---|
| 2025 | $2,335 | $227,762 | $41,760 | $186,002 |
| 2024 | $2,335 | $227,762 | $41,760 | $186,002 |
| 2023 | $2,335 | $219,298 | $41,760 | $177,538 |
| 2022 | $3,476 | $196,931 | $41,760 | $155,171 |
| 2021 | $3,570 | $153,165 | $29,580 | $123,585 |
| 2020 | $3,160 | $130,485 | $29,580 | $100,905 |
| 2019 | $3,302 | $130,485 | $29,580 | $100,905 |
| 2018 | $1,987 | $78,539 | $19,836 | $58,703 |
| 2017 | $1,986 | $78,539 | $19,836 | $58,703 |
| 2016 | $1,986 | $78,539 | $19,836 | $58,703 |
| 2015 | $1,634 | $63,560 | $19,836 | $43,724 |
| 2014 | $1,634 | $63,560 | $19,836 | $43,724 |
Source: Public Records
Map
Nearby Homes
- 8515 Carlisle St
- 8502 Detroit St Unit D
- 8502 Detroit St Unit C
- 8324 Jennings St
- 8145 Easton St
- 8432 Park Place Blvd
- 8158 Easton St
- 7 W Court Dr
- 8282 Park Place Blvd Unit D1
- 8282 Park Place Blvd Unit G2
- 8023 Findlay St
- 8250 Park Place Blvd Unit 303
- 7931 Scanlock St
- 7814 Glover St
- 7937 Grafton St
- 7313 Gulf Fwy Unit 814
- 7313 Gulf Fwy Unit 911
- 7313 Gulf Fwy Unit 1011
- 7303 Gulf Fwy Unit 903
- 3727 Broadway St
- 8537 Biloxi St
- 8533 Biloxi St
- 8544 Brockton St
- 8534 Brockton St
- 2911 Shady Park Dr
- 2915 Shady Park Dr
- 8529 Biloxi St
- 2907 Shady Park Dr
- 2801 Pine Gully Blvd
- 2919 Shady Park Dr
- 8544 Biloxi St
- 8540 Biloxi St
- 2903 Shady Park Dr
- 8525 Biloxi St
- 2923 Shady Park Dr
- 8536 Biloxi St
- 8532 Biloxi St
- 2927 Shady Park Dr
- 2834 Shady Park Dr
- 8535 Brockton St