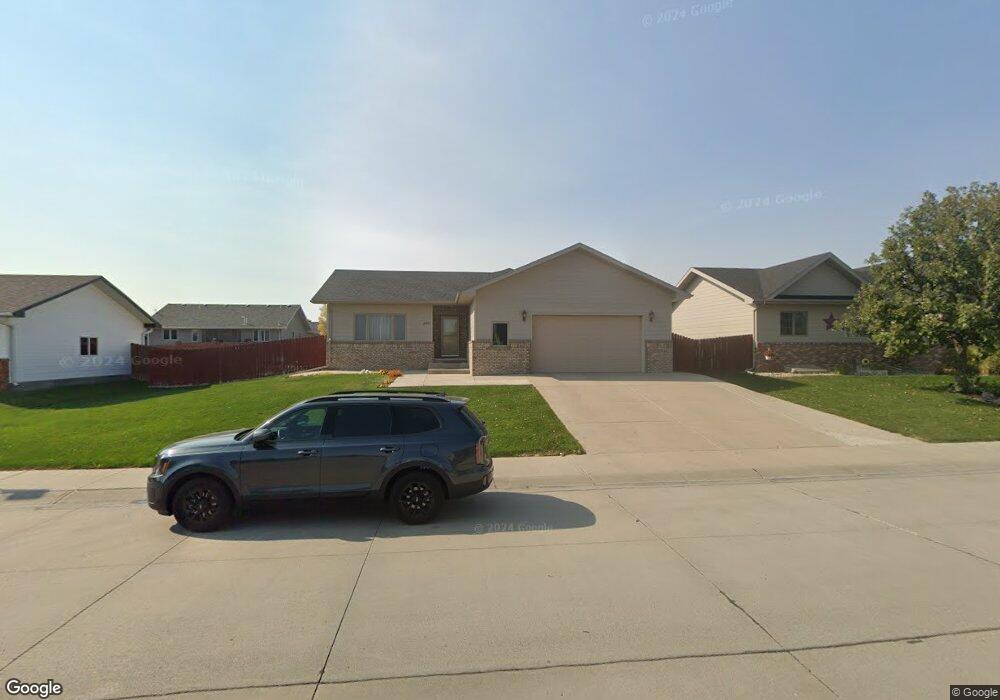
855 19th St Gering, NE 69341
Estimated Value: $334,000 - $392,000
3
Beds
4
Baths
1,632
Sq Ft
$225/Sq Ft
Est. Value
About This Home
This home is located at 855 19th St, Gering, NE 69341 and is currently estimated at $367,847, approximately $225 per square foot. 855 19th St is a home located in Scotts Bluff County with nearby schools including Gering High School and Community Christian Elementary/Middle School.
Ownership History
Date
Name
Owned For
Owner Type
Purchase Details
Closed on
Nov 19, 2013
Sold by
Rogers Joseph L and Rogers Shari L
Bought by
Singh Sukhjiwan and Kaur Gurdeep
Current Estimated Value
Home Financials for this Owner
Home Financials are based on the most recent Mortgage that was taken out on this home.
Original Mortgage
$187,200
Outstanding Balance
$139,084
Interest Rate
4.29%
Mortgage Type
New Conventional
Estimated Equity
$228,763
Purchase Details
Closed on
Jun 5, 2009
Sold by
Duncan Kenneth and Duncan Patricia
Bought by
Rogers Joseph L and Rogers Shari L
Home Financials for this Owner
Home Financials are based on the most recent Mortgage that was taken out on this home.
Original Mortgage
$206,150
Interest Rate
4.7%
Mortgage Type
New Conventional
Purchase Details
Closed on
Mar 3, 2005
Sold by
Griess Shane and Myers Amy
Bought by
Duncan Kenneth and Duncan Patricia
Create a Home Valuation Report for This Property
The Home Valuation Report is an in-depth analysis detailing your home's value as well as a comparison with similar homes in the area
Home Values in the Area
Average Home Value in this Area
Purchase History
| Date | Buyer | Sale Price | Title Company |
|---|---|---|---|
| Singh Sukhjiwan | $234,000 | Western Prairie Title | |
| Rogers Joseph L | $217,000 | -- | |
| Duncan Kenneth | $151,667 | -- |
Source: Public Records
Mortgage History
| Date | Status | Borrower | Loan Amount |
|---|---|---|---|
| Open | Singh Sukhjiwan | $187,200 | |
| Previous Owner | Rogers Joseph L | $206,150 |
Source: Public Records
Tax History
| Year | Tax Paid | Tax Assessment Tax Assessment Total Assessment is a certain percentage of the fair market value that is determined by local assessors to be the total taxable value of land and additions on the property. | Land | Improvement |
|---|---|---|---|---|
| 2025 | $5,825 | $346,240 | $25,350 | $320,890 |
| 2024 | $5,643 | $328,075 | $25,350 | $302,725 |
| 2023 | $5,893 | $274,984 | $19,408 | $255,576 |
| 2022 | $5,893 | $274,984 | $19,408 | $255,576 |
| 2021 | $5,596 | $258,264 | $19,408 | $238,856 |
| 2020 | $5,381 | $246,890 | $19,408 | $227,482 |
| 2019 | $5,250 | $246,890 | $19,408 | $227,482 |
| 2018 | $5,282 | $246,890 | $19,408 | $227,482 |
| 2017 | $5,102 | $238,141 | $19,408 | $218,733 |
| 2016 | $4,736 | $238,141 | $19,408 | $218,733 |
| 2015 | $4,594 | $231,770 | $19,408 | $212,362 |
| 2014 | $4,659 | $231,770 | $19,408 | $212,362 |
| 2012 | -- | $227,606 | $19,408 | $208,198 |
Source: Public Records
Map
Nearby Homes
Your Personal Tour Guide
Ask me questions while you tour the home.