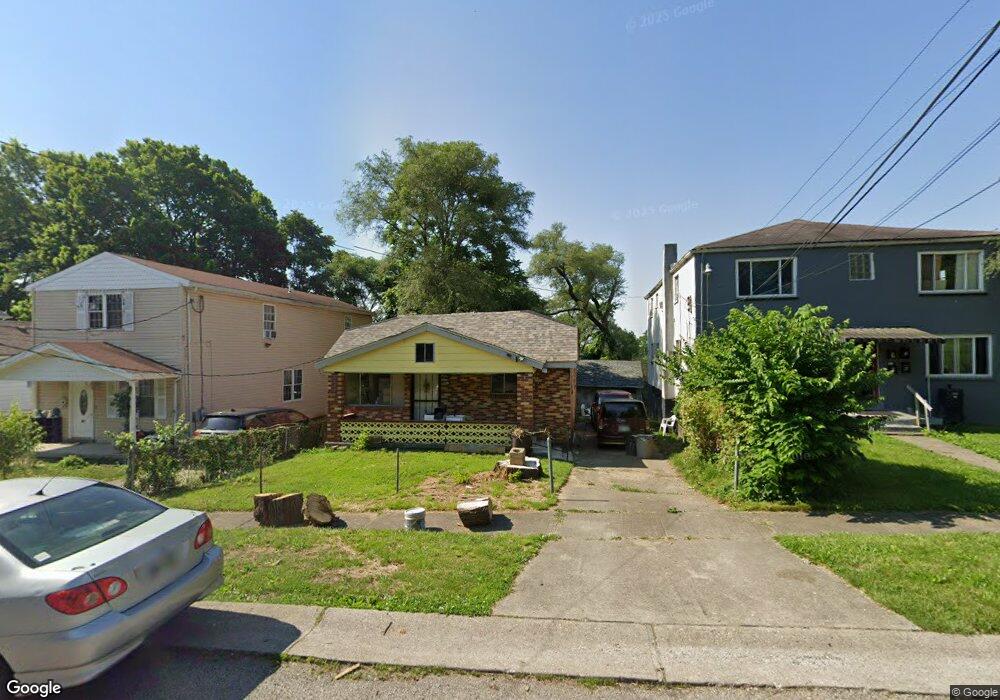
855 Byrd Ave Cincinnati, OH 45215
Estimated Value: $53,000 - $73,000
3
Beds
1
Bath
1,053
Sq Ft
$63/Sq Ft
Est. Value
About This Home
This home is located at 855 Byrd Ave, Cincinnati, OH 45215 and is currently estimated at $66,022, approximately $62 per square foot. 855 Byrd Ave is a home located in Hamilton County with nearby schools including Lincoln Heights Elementary School, Princeton Community Middle School, and Princeton High School.
Ownership History
Date
Name
Owned For
Owner Type
Purchase Details
Closed on
Nov 26, 2024
Sold by
Brooks Christina
Bought by
Miranda Alfonzo Escobedo and Mollina Maria Dela
Current Estimated Value
Purchase Details
Closed on
Nov 6, 2024
Sold by
Fincher Joyce A
Bought by
Brooks Christina
Purchase Details
Closed on
Feb 14, 2013
Sold by
Fincher Yolonda and Fincher Joyce A
Bought by
Fincher Joyce A
Purchase Details
Closed on
Oct 25, 2012
Sold by
Fincher Yolonda
Bought by
Fincher Yolonda and Fincher Joyce A
Purchase Details
Closed on
Mar 20, 2009
Sold by
Fincher Joyce A
Bought by
Fincher Yolonda
Purchase Details
Closed on
Oct 3, 2008
Sold by
Estate Of Roosevelt Fincher
Bought by
Fincher Joyce A
Purchase Details
Closed on
Sep 30, 2008
Sold by
Estate Of Francina Fincher
Bought by
Fincher Joyce A
Purchase Details
Closed on
Nov 4, 1995
Sold by
Fincher Roosevelt and Fincher Francina
Bought by
Fincher Roosevelt and Fincher Francina
Create a Home Valuation Report for This Property
The Home Valuation Report is an in-depth analysis detailing your home's value as well as a comparison with similar homes in the area
Home Values in the Area
Average Home Value in this Area
Purchase History
| Date | Buyer | Sale Price | Title Company |
|---|---|---|---|
| Miranda Alfonzo Escobedo | $47,000 | None Listed On Document | |
| Miranda Alfonzo Escobedo | $47,000 | None Listed On Document | |
| Brooks Christina | $15,000 | None Listed On Document | |
| Brooks Christina | $15,000 | None Listed On Document | |
| Fincher Joyce A | -- | Attorney | |
| Fincher Yolonda | -- | Attorney | |
| Fincher Yolonda | -- | Attorney | |
| Fincher Joyce A | -- | Attorney | |
| Fincher Joyce A | -- | Attorney | |
| Fincher Roosevelt | -- | -- |
Source: Public Records
Tax History
| Year | Tax Paid | Tax Assessment Tax Assessment Total Assessment is a certain percentage of the fair market value that is determined by local assessors to be the total taxable value of land and additions on the property. | Land | Improvement |
|---|---|---|---|---|
| 2025 | $669 | $8,219 | $1,236 | $6,983 |
| 2024 | $105 | $8,219 | $1,236 | $6,983 |
| 2023 | $112 | $8,219 | $1,236 | $6,983 |
| 2022 | $229 | $7,592 | $1,236 | $6,356 |
| 2021 | $149 | $7,592 | $1,236 | $6,356 |
| 2020 | $162 | $7,592 | $1,236 | $6,356 |
| 2019 | $168 | $7,592 | $1,236 | $6,356 |
| 2018 | $163 | $7,592 | $1,236 | $6,356 |
| 2017 | $152 | $7,592 | $1,236 | $6,356 |
| 2016 | $60 | $6,587 | $1,561 | $5,026 |
| 2015 | $72 | $6,587 | $1,561 | $5,026 |
| 2014 | $77 | $6,587 | $1,561 | $5,026 |
| 2013 | $91 | $8,236 | $1,953 | $6,283 |
Source: Public Records
Map
Nearby Homes
- 857 Steffen Ave
- 1076 Schumard Ave
- 1282 Steffen Ave
- 1401 Chamberlain Ave
- 405 Home Ave
- 1201 Dixie Ct
- 519 Westview Ave
- 1118 Burns Ave
- 1019 Crosley Ave
- 15 Bonham Rd
- 1239 Springfield Pike
- 1704 Harmon Dr
- 10152 Chester Rd
- 1100 Timberland Dr
- 11 Rolling Hills Ct
- 502 Marion Rd
- 127 Locust St
- 10167 Wayne Ave
- 0 E Leslie Ave
- 701 W Wyoming Ave
Your Personal Tour Guide
Ask me questions while you tour the home.