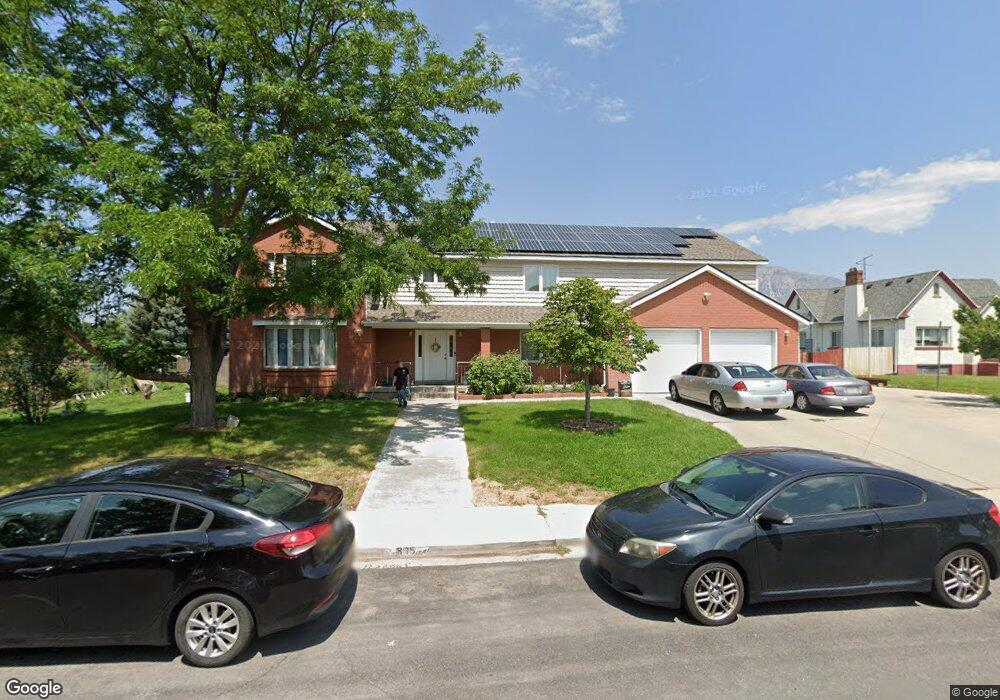
855 E 200 S Orem, UT 84097
Riverside NeighborhoodEstimated Value: $760,000 - $994,000
4
Beds
5
Baths
4,113
Sq Ft
$214/Sq Ft
Est. Value
About This Home
This home is located at 855 E 200 S, Orem, UT 84097 and is currently estimated at $880,746, approximately $214 per square foot. 855 E 200 S is a home located in Utah County with nearby schools including Centennial Elementary, Canyon View Junior High School, and Orem High School.
Ownership History
Date
Name
Owned For
Owner Type
Purchase Details
Closed on
Aug 26, 2016
Sold by
Loveridge Robert
Bought by
Loveridge Robert L and Loveridge Maryellen W
Current Estimated Value
Create a Home Valuation Report for This Property
The Home Valuation Report is an in-depth analysis detailing your home's value as well as a comparison with similar homes in the area
Home Values in the Area
Average Home Value in this Area
Purchase History
| Date | Buyer | Sale Price | Title Company |
|---|---|---|---|
| Loveridge Robert L | -- | Accommodation | |
| Loveridge Robert | -- | Highland Title |
Source: Public Records
Tax History
| Year | Tax Paid | Tax Assessment Tax Assessment Total Assessment is a certain percentage of the fair market value that is determined by local assessors to be the total taxable value of land and additions on the property. | Land | Improvement |
|---|---|---|---|---|
| 2025 | $3,793 | $446,215 | -- | -- |
| 2024 | $3,793 | $463,815 | $0 | $0 |
| 2023 | $3,603 | $473,550 | $0 | $0 |
| 2022 | $3,468 | $441,595 | $0 | $0 |
| 2021 | $3,153 | $608,100 | $203,000 | $405,100 |
| 2020 | $2,912 | $551,900 | $162,400 | $389,500 |
| 2019 | $2,478 | $488,300 | $149,600 | $338,700 |
| 2018 | $2,525 | $475,500 | $136,800 | $338,700 |
| 2017 | $2,281 | $230,120 | $0 | $0 |
| 2016 | $2,030 | $188,815 | $0 | $0 |
| 2015 | $1,937 | $170,445 | $0 | $0 |
| 2014 | $1,703 | $149,105 | $0 | $0 |
Source: Public Records
Map
Nearby Homes
Your Personal Tour Guide
Ask me questions while you tour the home.