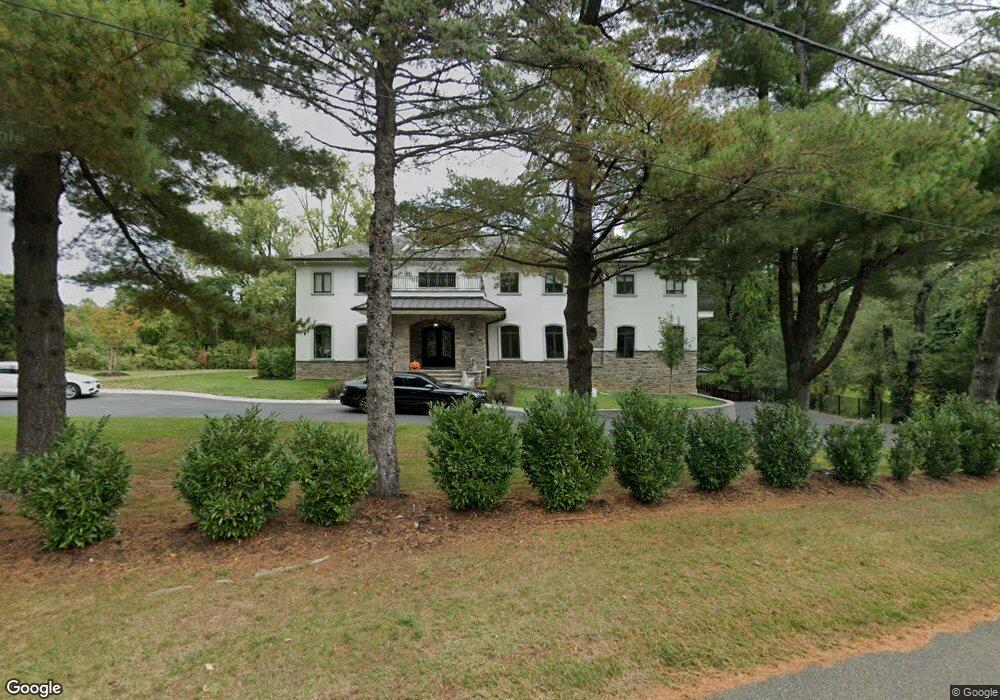
855 Holmdel Rd Holmdel, NJ 07733
Estimated Value: $1,802,000 - $2,551,792
5
Beds
5
Baths
6,766
Sq Ft
$311/Sq Ft
Est. Value
About This Home
This home is located at 855 Holmdel Rd, Holmdel, NJ 07733 and is currently estimated at $2,105,698, approximately $311 per square foot. 855 Holmdel Rd is a home located in Monmouth County with nearby schools including Village School, Indian Hill Elementary School, and William Satz Intermediate School.
Ownership History
Date
Name
Owned For
Owner Type
Purchase Details
Closed on
Jun 29, 2018
Sold by
Dailey Derek and Dailey Alison
Bought by
Dailey Derek
Current Estimated Value
Purchase Details
Closed on
Jan 17, 2007
Sold by
Johnson Vincent C and Johnson Susan M
Bought by
Dailey Derek and Dailey Alison
Home Financials for this Owner
Home Financials are based on the most recent Mortgage that was taken out on this home.
Original Mortgage
$488,000
Interest Rate
6.24%
Mortgage Type
Unknown
Create a Home Valuation Report for This Property
The Home Valuation Report is an in-depth analysis detailing your home's value as well as a comparison with similar homes in the area
Home Values in the Area
Average Home Value in this Area
Purchase History
| Date | Buyer | Sale Price | Title Company |
|---|---|---|---|
| Dailey Derek | -- | Fidelity National Title | |
| Dailey Derek | $610,000 | First American Title Ins Co |
Source: Public Records
Mortgage History
| Date | Status | Borrower | Loan Amount |
|---|---|---|---|
| Previous Owner | Dailey Derek | $488,000 |
Source: Public Records
Tax History
| Year | Tax Paid | Tax Assessment Tax Assessment Total Assessment is a certain percentage of the fair market value that is determined by local assessors to be the total taxable value of land and additions on the property. | Land | Improvement |
|---|---|---|---|---|
| 2025 | $38,238 | $2,653,500 | $416,600 | $2,236,900 |
| 2024 | $38,145 | $2,426,300 | $370,500 | $2,055,800 |
Source: Public Records
Map
Nearby Homes
- 11 Goldsmith Dr
- 1 Flora Dr
- 118 State Route 34
- 7 Flora Dr
- 3 Forest Park Ct
- 14 Schanck Rd
- 1 Davey Place
- 798 Holmdel Rd
- 8 Tiberon Dr
- 16 S Beers St
- 3 Tolas Dr
- 47 White Oak Ln
- 10 Deercrest Dr
- 99 Idlebrook Ln
- 611 Wellington Place
- 323 Arlene Terrace
- 72 Idlebrook Ln
- 23 Stratford Ln Unit 483
- 315 Wellington Place
- 16 Briarhill Rd
Your Personal Tour Guide
Ask me questions while you tour the home.