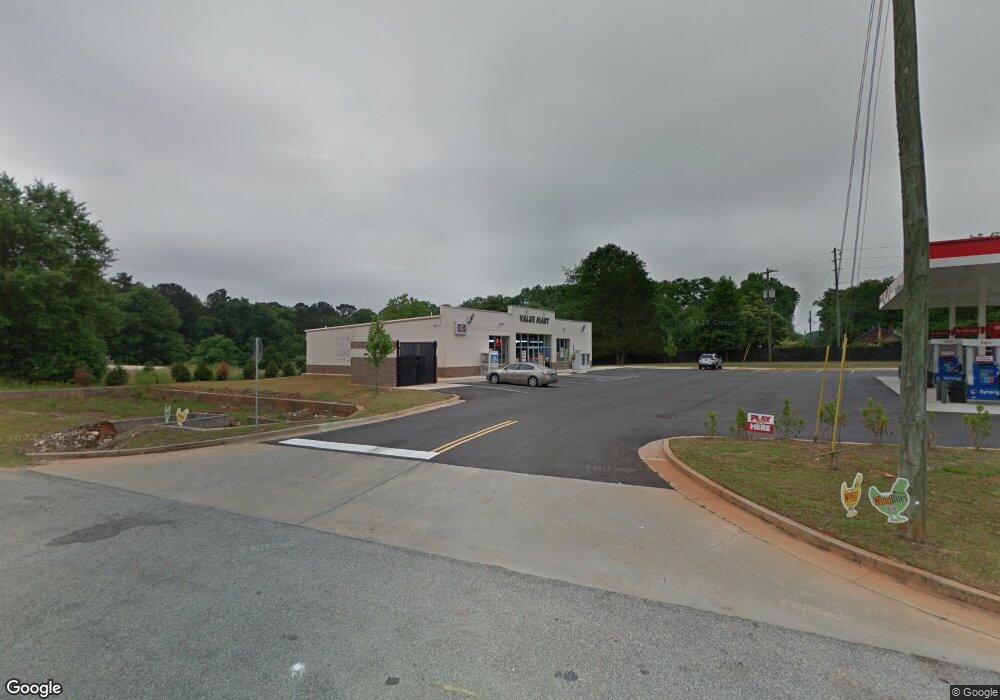
855 Jefferson Hwy Unit 1 Winder, GA 30680
Estimated Value: $3,615,861
--
Bed
--
Bath
4,080
Sq Ft
$886/Sq Ft
Est. Value
About This Home
This home is located at 855 Jefferson Hwy Unit 1, Winder, GA 30680 and is currently estimated at $3,615,861, approximately $886 per square foot. 855 Jefferson Hwy Unit 1 is a home located in Barrow County with nearby schools including Holsenbeck Elementary School, Bear Creek Middle School, and Winder-Barrow High School.
Ownership History
Date
Name
Owned For
Owner Type
Purchase Details
Closed on
Dec 13, 2018
Sold by
Rockmore Properties Inc
Bought by
Shanya Investment Grp Llc
Current Estimated Value
Home Financials for this Owner
Home Financials are based on the most recent Mortgage that was taken out on this home.
Original Mortgage
$158,000
Interest Rate
4.9%
Mortgage Type
New Conventional
Purchase Details
Closed on
Oct 19, 2017
Sold by
White Dewey C
Bought by
Rockmore Properties Inc
Purchase Details
Closed on
Jan 10, 2011
Sold by
Fifth Third Bk
Bought by
White Dewey C
Purchase Details
Closed on
Jun 2, 2009
Sold by
Joseph Michael K
Bought by
Fifth Third Bank
Purchase Details
Closed on
Mar 31, 2000
Sold by
Bailey J Rickey
Bought by
And Joseph Michael K
Purchase Details
Closed on
Feb 26, 1997
Sold by
Pruett Leeon
Bought by
Bailey J Rickey
Purchase Details
Closed on
Jan 7, 1997
Sold by
Worley Bob A
Bought by
Pruett Leeon
Create a Home Valuation Report for This Property
The Home Valuation Report is an in-depth analysis detailing your home's value as well as a comparison with similar homes in the area
Home Values in the Area
Average Home Value in this Area
Purchase History
| Date | Buyer | Sale Price | Title Company |
|---|---|---|---|
| Shanya Investment Grp Llc | $1,921,000 | -- | |
| Rockmore Properties Inc | $181,000 | -- | |
| White Dewey C | $130,000 | -- | |
| Fifth Third Bank | $430,000 | -- | |
| Fifth Third Bank National Assoc | -- | -- | |
| And Joseph Michael K | $146,000 | -- | |
| Bailey J Rickey | $164,400 | -- | |
| Pruett Leeon | -- | -- |
Source: Public Records
Mortgage History
| Date | Status | Borrower | Loan Amount |
|---|---|---|---|
| Closed | Shanya Investment Grp Llc | $158,000 |
Source: Public Records
Tax History Compared to Growth
Tax History
| Year | Tax Paid | Tax Assessment Tax Assessment Total Assessment is a certain percentage of the fair market value that is determined by local assessors to be the total taxable value of land and additions on the property. | Land | Improvement |
|---|---|---|---|---|
| 2024 | $5,346 | $212,049 | $33,524 | $178,525 |
| 2023 | $5,388 | $212,049 | $20,340 | $191,709 |
| 2022 | $6,364 | $217,244 | $22,140 | $195,104 |
| 2021 | $13,867 | $458,561 | $98,400 | $360,161 |
| 2020 | $13,907 | $458,561 | $98,400 | $360,161 |
| 2019 | $14,158 | $458,561 | $98,400 | $360,161 |
| 2018 | $2,290 | $71,931 | $36,000 | $35,931 |
| 2017 | $1,903 | $65,358 | $36,000 | $29,358 |
| 2016 | $2,056 | $65,358 | $36,000 | $29,358 |
| 2015 | $1,769 | $65,358 | $36,000 | $29,358 |
| 2014 | $1,902 | $57,930 | $20,160 | $37,770 |
| 2013 | -- | $57,169 | $17,640 | $39,529 |
Source: Public Records
Map
Nearby Homes
- 173 Equestrian Walk
- 662 Carla Ct
- 273 Greystone Ct
- 547 Hickeria Way
- 421 Arrowhatchee Dr
- 372 Ashton Way
- 826 Crystal Meadow Dr
- 303 Rooks Rd
- 855 Crystal Meadow Dr
- 475 Pendergrass Rd
- 1815 Alberta Ln
- 457 Banff Dr
- 1311 Calgary Lake Dr
- 867 Windward Rd
- 466 Pendergrass Rd
- 558 Calgary Downs Dr
- 454 Banff Dr
- 560 Calgary Downs Dr
- 450 Banff Dr
- 448 Banff Dr
- 855 Jefferson Hwy
- 0 Hwy 211ne
- 843 Jefferson Hwy
- 560 Rockwell Church Rd NE
- 878 Jefferson Hwy
- 837 Jefferson Hwy
- 551 Rockwell Church Rd NE
- 554 Rockwell Church Rd NE
- 551 Hilldale Cir
- 882 Jefferson Hwy
- 549 Hilldale Cir
- 550 Rockwell Church Rd NE
- 547 Hilldale Cir
- 546 Rockwell Church Rd NE
- 545 Rockwell Church Rd NE
- 550 Hilldale Cir
- 544 Rockwell Church Rd NE
- 545 Hilldale Cir
- 541 Hilldale Dr
- 543 Rockwell Church Rd NE